Monthly Net Worth & Goals Update – November 2009

Net Worth Chart 2009

Credit Card Debt
In the past, I have taken money from credit cards at 0% APR and placed it into online savings accounts, bank CDs, or savings bonds that earn 4-5% interest (much less recently), and keeping the difference as profit. I even put together a series of step-by-step posts on how to make money off of credit cards in this way.

However, given the current lack of great no fee 0% APR balance transfer offers, I am no longer playing this “game” and have just paid off my last 0% offer for now. This makes the net worth chart a bit funny, but it should clear up next month.

Retirement and Brokerage accounts
Our total investment portfolio increased by a few thousand dollars since last month. DW’s 401k was already maxed out at $16,500. I made another $1,000 contribution to my Solo 401k, for a total of $16,500 contributed in 2009 as well. (I forgot the limit was $16,500 and not $15,500 last month…) This makes us done with our goal of maxing out both our 401k salary contributions for 2009.

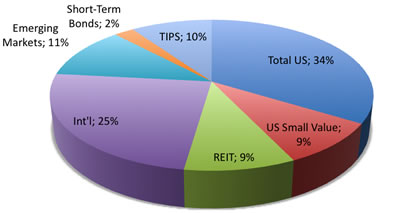
I am starting to build up too much cash, and have started investing for retirement in a taxable brokerage account as well. In the interest of tax efficiency, I’ll have to move around some investments in order to keep bonds in the tax-advantaged IRAs/401k and the “extra” stocks in taxable. I expect to finish investing $20,000 this week.

Taking that additional 20k into account, our total retirement portfolio is now $211,095, or on an estimated after-tax basis, $170,047. At a 4% withdrawal rate, this would provide $567 per month in tax-free retirement income, which brings me to 23% of my long-term goal of $2,500 per month.

Cash Savings and Emergency Funds
We keep a year’s worth of expenses in our emergency fund. Another $10,000 is earmarked for upcoming home improvement projects that I keep putting off (minor roof repair and solar water heating).

Home Value
I am no longer using any internet home valuation tools to track home value. Some people have suggested using my tax assessed value, but I also think that is too high. I simply picked what I felt is a conservative number based on recent comparables, $480,000, and keep it for at least 6 months if not a year. (Currently on month 2 out of 6.) For the most part I am concerned about mortgage payoff, which I still plan to accomplish in 20 years at most.

You can view previous net worth updates here.

Reader Question: What If My 401k Has Horrible Investment Options?

Here’s another good reader question about crappy 401k plans. Reader Robert saves enough to max out his 401k each year if he wanted to, in addition to maxing out his Roth IRA every year which he already does. However, his 401k plan is filled with expensive actively-managed mutual funds. He has no company match. Should he contribute to his 401k anyway, or invest outside in a taxable account?

Factor #1: How Long Will You Keep Your Job?
Even if you have a bad 401k plan, remember that as soon as you leave that company, you can roll over those tax-advantaged funds into a Rollover IRA at the company of your choice! You may or may not have a good idea of how long you’ll stay there, but the fact is most of my friends have not worked at any company longer than 5 years or so.

(A few plans offer what is called in-service withdrawals, where you can roll over your 401k fund into a IRA without leaving your employer. These are rare, but it’s worth asking about.)

Factor #2: Can You Help Your HR Department Make A Change?
The reason why expensive 401k plans exist is because they tend to be cheap for the employer. Essentially, the administrative costs for running the plan are shifted to the employees. Big companies tend to have better plans because they offer enough assets for companies like Vanguard to jump in.

Still, you might be able to enact some change. Print out some material about how high plan expenses can really hurt performance and thus people’s retirements. Talk to your co-workers, and make it an worker attraction/retention issue. You may not need to switch providers, but perhaps they’ll at least offer a better option or two. I’ve even read about Congress considering a law requiring all 401k plan administrators offering at least one index fund option.

Factor #3: How Expensive Is It?
Unfortunately for Robert, he shared his available investment options along with their annual expense ratios, and they are the worst I’ve seen yet:

Blackrock Fundamental Growth C MCFGX 1.94%
Blackrock Global Allocation C MCLOX 1.88%
Blackrock Government Income Portfolio C1 BGIEX 1.53%
Blackrock International Value C MCIVX 2.60%
Blackrock Large Cap Core C MCLRX 1.97%
Blackrock Large Cap Value C MCLVX 2.00%
Blackrock Value Opportunities C MCSPX 2.34%
Davis New York Venture C NYVCX 1.71%
Evergreen Core Bond C ESBCX 1.45%
J P Morgan Dynamic Small Cap Growth C VSCCX 2.12%
Mfs Total Return C MTRCX 1.52%

It may be tempting to think “well, no matter how bad the plan is, it will still be better than a taxable account, right?” Wrong. Actually, given current tax rates, it can be better to keep your money in a taxable brokerage account than in a 401(k) plan if the options are expensive enough. Here are some quick and dirty examples.

Let’s say you put in $10,000 in a taxable account. You invest in an index fund with 0.20% expense ratio. The broad US stock market earns 8% per year. Since you get the gains minus expenses, you get 7.8% per year. You get a 15% tax hit at the end for long-term capital gains. Your final after-tax balance after 30 years is $80,906. (Yes, I’m ignoring the annual taxation of dividends for now.)

10,000 x 1.078^30 x 0.85 = $80,906

Let’s say you put in $10,000 of after-tax money in a Roth 401(k). You buy a Blackrock fund with 2% expense ratio. Again, on average, all mutual funds that invest in the broad US stock market will earn the market returns (8%) minus expenses (2%), giving you a 6% return per year. However, you have no tax hit at the end since it is a Roth. (You’d get the same result with pre-tax money in a Traditional 401k.) Your final after-tax balance is only $57,434.

10,000 x 1.06^30 = $57,434

The above is a very simplified comparison, but the point is that the gradual annual hit of a high expense ratio can overcome the tax break advantage. Usually this takes an expense ratio above 1% and a long time horizon.

Recap / WWMMBD
If you think that your current plan options will continue to be this bad for the next 10 years or more, and you don’t think you’ll leave your company before then, then it may indeed be better to just invest outside a 401k plan. (Keep up the IRA contributions!) However, I think that soon 401k plans will be more tightly regulated, and the trend is for plans to at least offer a few low-cost options. I know my plan seems to get a little better every year. If it were me, I’d probably suck it up and still tuck money away in the 401k in the hopes of a brighter future.

Paradox Of Financial Choices: Maximizing vs. Satisficing

In the book Paradox of Choice by Barry Schwartz, he talks about how there are two types of people, maximizers and satisficers (think satisfy + suffice). I will simply quote the excellent summary from the book’s Wikipedia page:

A maximizer is like a perfectionist, someone who needs to be assured that their every purchase or decision was the best that could be made. The way a maximizer knows for certain is to consider all the alternatives they can imagine. This creates a psychologically daunting task, which can become even more daunting as the number of options increases. The alternative to maximizing is to be a satisficer. A satisficer has criteria and standards, but a satisficer is not worried about the possibility that there might be something better. Ultimately, Schwartz agrees with Simon’s conclusion, that satisficing is, in fact, the maximizing strategy.

If you can’t tell already after 10 seconds of reading this site, I am a hardcore maximizer. I love collecting data, poring over alternatives, finding out secret exceptions, all so I can choose the “best” choice. I prefer the term “good enough-er” to satisficer. For some people, the second it reaches the “good enough” stage, they are done and move on.

A Pathetic Maximizer Story
This happened just last week. A friend of mine comes over, and brings some McDonald’s with him. After he leaves, I go to throw out the garbage but notice an unpeeled Monopoly game piece. I peel it out of curiosity, but I get no instant-win and two random streets (St. James Place and Atlantic Avenue). But wait… I vaguely know that one of the rules of the game is that if you collect all the streets of a neighborhood (same color), you win a cash prize. However, some streets are given out all the time, while others are very rare. What if I had one of the rare pieces?

Of course, I then had to fire up the computer and search for the rare pieces. Lo and behold, Wikipedia also has a list of all the rare pieces. For example, Ventnor Avenue is also yellow like Atlantic, but is always the “missing” piece and thus essentially worth $25,000 by itself. My pieces were of course worthless. But I still had to know.

Maximizing and Investing
I began to think about how this relates to personal finance. In investing, you’d obviously like to maximize your returns. However, it is very difficult to know in advance which stock or mutual fund will outperform the rest. You could read books, financial statements, interview executives, or watch CNBC all day. You could listen to Warren Buffett’s every bowel movement and dissect all his annual shareholder letters for hints and tips.

Or if you’re like me, you may decide that even though the market isn’t perfectly efficient, it is still very efficient especially when costs like mutual fund fees, trade commissions, and tax considerations are taken into account. I now invest passively, and agree to be “satisficed” with the returns of the world markets minus costs. But even here, I am trying to maximize my returns by minimizing costs by buying Vanguard index funds or similar ETFs so that my portfolio costs less than 0.20% of assets annually.

Better to Satisfice?
The things I could maximize financially go on and on. From bank interest rates to cell phone plans, credit card reward structures to auto insurance premiums. Would I be happier if I just picked something “good enough” and moved on? Perhaps it is you readers that are the smartest, letting us slightly kooky bloggers do all the research for you, and then just picking what is good enough for you! 😉

Where maximizing hurts most is when it stops you from taking action. It doesn’t matter if your interest rate is 1.8% vs. 1.85% when your money is still stuck in a 0% checking account at some megabank. It doesn’t matter if you get the optimal 401k asset allocation if you’re not even contributing the most you can to the plan. For me, I have been putting off fixing up my house and adding solar hot water for several months because I want to find the “best” contractor. Meanwhile, I’m still using too much electricity and the tax breaks may expire.

Are there some things where you maximize, and others where you satisfice?

Learning About Bonds: Interest Rate Risk, Time Horizons, and Duration

For a long time, the my knowledge of bonds could be summed up in one sentence: Bonds are an IOU where you lend money to someone and they pay you interest plus your principal back eventually. There are many risks with bonds, and just two of them are credit risk and interest rate risk. Credit risk is the possibility that you won’t be paid back. Interest rate risk is the fact that once you’ve bought a bond, the value of that bond varies with prevailing interest rates.

Why Bond Values Change With Interest Rates
Let’s say you bought a bond from the US Treasury for $1,000 at pays 4% annual interest once a year ($40). What if the next day, market conditions change and now the US Treasury offers $1,000 bonds paying 5% interest ($50). Nobody would buy your bond for $1,000 anymore, they’d only pay $800 for it, since $40 is 5% of $800. This is why you may have read that bond prices tend to move in the opposite direction of interest rates.

So what’s the next level of understanding? I think this recent Vanguard Blog article on bonds expands on things nicely. The primary point is that the impact of rising or falling rates on bond returns varies depending on time horizons and the duration of your bonds.

Maturity vs. Duration
When you look at the stats for a bond mutual fund, you’ll see both average maturity and average duration. While a bond’s maturity is how long before your principal is repaid, the fact that most bonds pay out regular interest payments (coupons) changes the actual sensitivity to interest rates. This is where average duration comes in – it takes into account the relative discounted cash flows to accurately measure price sensitivity with respect to interest rate. Short version: Look at duration, not just maturity.

Time Horizons
The table taken from the article shows how the impact of interest rates changes with time horizon. In this scenario, you have a bond fund with a duration of 5.8 years and an initial yield to maturity of 4%. Then we see what happens if rates either stay the same, rise to 6%, or drop to 2%. (Rates are assumed to change evenly over two years). As with most bond funds, the interest income is continuously reinvested into new bonds.

If your time horizon is a lot shorter than your duration, then we see that the major risk is rising interest rates. Rising rates can crush your returns, while falling rates can boost them. However, if your time horizon is a lot longer than your duration, then the larger risk is lower interest rates, because as you re-invest your interest payments into new bonds (with lower interest rates), those lower rates will hurt your return in the long run.

Another interest thing to notice is that if you held for the exact length of the duration, 5.8 years in this case, then your annualized return would be very close to your initial yield of 4%, regardless of whether rates rose or fell.

In general, if you’re saving for a short-term goal, it may be wise to pick a duration that is also short enough so that interest rate swings won’t wipe you out. If your time horizon is for a retirement that is decades away, then picking a duration for a bond fund is more about other factors than just predicting upcoming interest rates. Remember, future higher interest rates can actually help your long-term returns. For example, consider the balance between the increased volatility of long-term bonds with their higher long-term historical returns.

Will Replacing 401(k) Plans With Portable Pensions Fix Retirement Planning?

stool
Traditional Three Legged Stool of Retirement
(post, image via Michigan.gov)

Over the weekend, I finally got around to reading this Time magazine article about Why It’s Time to Retire the 401(k) which has been getting some buzz. The author promotes bringing back what I call “portable pensions” to replace the employee-controlled 401(k) plan, which would guarantee say 50% of your last year’s salary for the rest of your life. Sounds nice, but how will it work, and who’ll pay for it?

Take the Mr. Shively in the article, who is still working at 68. About 25 years ago, his employer dropped the pension and replaced it with a 401(k). Over those two and a half decades, he has managed to save $70,000 in a 401(k). Yet it is suggested that if only his company kept the pension, he would be getting $1,308 per month, or $15,700 a year. Such a lifetime of cashflow from age 65 would cost at least $200,000 according to ImmediateAnnuities.com ($250,000 if joint, covering a spouse also age 65). Where did the $130,000-$180,000 difference come from?

Pensions are more expensive to run than 401(k) plans. Let’s say you have average employees making $50,000 a year and you match 100% up to 5%. That costs $2,500 a year – bang, you’re done, and you don’t have to worry about investing the money to meet future liabilities. Where does the savings go? Either Shively got paid more (through higher salary or matching contributions) and didn’t save it, or his employer pocketed the savings, or likely a little of both.

This brings us to the other problems of the 401(k) system are, which were explored in this 2001 Barron’s article by William Bernstein after the last stock market crash. “The 401(k) is likely to turn out to be a defined-chaos
retirement plan.”

Employees are not saving enough. Will this be fixed by a portable pension? Only if employers are willing to pay higher total compensation, which is unlikely. Otherwise, will people really be okay with forced savings like an additional mandatory 5-10% contribution? Folks tend to see that as a tax, like Social Security.

Investors are depending on future market returns which will likely not be as high as in the past. The idea of gaining 8% per year, 5% after inflation, sounds nice but may not happen in the future. Current P/E ratios are still above average current. This means people will need to save even more than they thought. Again, where will this money come from?

401(k) expenses are too high, which reduces returns even further. Having a guaranteed income for life requires insurance companies. Which means instead of mutual fund expenses, you’ll have hidden insurance fees and guaranteed returns that will have to be significantly less that market returns. If more transparency and direct competition existed, perhaps the costs could be minimized.

Investors have poor investing knowledge. This is kind of an unsaid reason of why 401(k)s are bad, because there will always be those invested poorly. My concern is related to this recency bias. 401ks got traction initially because markets were hot at the time. Talk of pensions increase now because the recent performance was awful. What happens when the markets get hot again? Will people be happy with their 6% steady increases when others are gaining 30% in year?

I’d like to see what happens with this “portable pension” idea, but the practical realities concern me.

Strong 2009 Market Returns So Far: Time To Rebalance?

If you haven’t noticed already through your portfolio statements – the stock markets are doing well in 2009. The broad US stock market and the broad developed international markets are up 22% and 29%, respectively. Some funds are doing especially well, such as the Vanguard Emerging Markets Stock Index Fund (VEIEX) which is up +62.6% year-to-date.

Vanguard recently sent me a newsletter with a link to an article titled Strong 2009 performance warrants yellow flag, which states in part:

While it may be gratifying to see these robust gains lift the balances of your funds, the markets have “come a long way in a hurry,” as the saying goes. At this point, it may be wise to ensure that your asset allocation is in line with your long-term goals.

A discussion thread on this article at Bogleheads had member Robert T pointing out the following comparisons in 2008 and 2009 YTD performance data:

Many of the asset classes that got hit the worst in 2008, have made the largest comebacks. Of course, we can’t know for sure if this surge will continue or if we’re headed back down again. But I think Vanguard’s advice is sound, to make sure our asset allocations are on target. If you had the guts to rebalance at the end of 2008, then buying more stocks “low” would have paid off nicely. Right now, you’ll want to make sure you’re not overweight in stocks.

I have been using my ongoing investments to balance out my asset allocation through the year, but as my latest portfolio snapshot shows, I am still overweight in Emerging Markets and underweight in bonds.

Is your asset allocation where you want it to be?

P2P Lending Update: LendingClub Loan Performance (+$25 Bonus)

Here’s an update for my person-to-person (P2P) lending activity at LendingClub, which are unsecured loans between U.S. residents. It could be to help people pay off credit card debt, home improvements, business financing, or even buying a house. You can think of it as taking out the bank middleman, which pays tiny interest on checking account balances and then charges much higher rates to borrowers.

LendingClub Portfolio
I now have made 62 active loans with $1,680.08 in outstanding principal. Most are A grade, with a decent spattering of Bs. Keep in mind that a borrower has to have a 660 credit score as well as other additional requirements just to make their lowest G grade. (Only about 10% of loan applications are accepted.) Although they do have an automated service to pick for you, I tend to pick my own loans to try and find both a combination of good risk profile and also a person who I want to help out. It’s kind of a hobby of mine. Here is a screenshot from my account page:

Performance & Commentary
The good news is that out of my two previous late loans, one of them is now current again and the other one is on a “payment plan”. I am not sure if that means they lowered the amount due, or that they are just allowing a slower payback temporarily, but it is again showing regular payments (and contact) from the borrower. Much better than reading “left voicemail. left voicemail. we haven’t heard from them in 4 months…”. I have no defaults to date.

According to LC, my “Net Annualized Return on Investment” based on my interest payments received so far is 9.14%. As an investor, I would not expect this rate to be my actual rate to maturity, but so far so good. While my goal is to get a substantially higher yield than from a online savings account, it also comes with a healthy dose of risk. Don’t put your emergency fund here!

$25 New Lender Bonus
If you are interested trying P2P lending with no risk, you can still use this special $25 lender sign-up link to get a free $25 to try it out with no future obligation. There is no credit check and you don’t even have to deposit anything. After you are approved, the $25 will show up in your account balance, and you can lend it out immediately.

If you’re looking to borrow at LendingClub, it’s relatively straightforward. Send in your information, and see what interest rate they offer you. Compare it with your credit card or other financing options. If you like it, fill out your application carefully (verify income if possible) and go for it. If you don’t like the rate or the full amount is not funded, you can either accept partial funding or walk away with no obligation.

Monthly Net Worth & Goals Update – October 2009

Net Worth Chart 2009

Credit Card Debt
For newer readers, I have taken money from credit cards at 0% APR and placed it into online savings accounts, bank CDs, or savings bonds that earn 4-5% interest (much less recently), and keeping the difference as profit. I even put together a series of step-by-step posts on how to make money off of credit cards in this way. However, given the current lack of great no fee 0% APR balance transfer offers, I am mostly waiting on existing offers to end.

Retirement and Brokerage accounts
Wife’s 401k was already maxed out at $16,500 for 2009. I made another $5,500 contribution to my Solo 401k, for a total of $15,000 contributed in 2009. This makes us about 95% done with our goal of maxing out both our 401k salary contributions for 2009.

Our total retirement portfolio is now $190,085, or on an estimated after-tax basis, $152,349. At a 4% withdrawal rate, this would provide $508 per month in tax-free retirement income, which brings me to 20% of my long-term goal of $2,500 per month.

Cash Savings and Emergency Funds
We still have a little over a year’s worth of expenses in our emergency fund. Part of the cash is earmarked for some smaller home improvement projects.

The next step is to put future funds into buying ETFs in a taxable brokerage account since I no longer have room in tax-sheltered accounts. I’ll probably use TradeKing or Scottrade as my buy-and-hold ETF broker, and keep Zecco as my “play money” account.

Home Value
I am no longer using any internet home valuation tools to track home value. If I still did, it would have been $572,000. Some people have suggested using my tax assessed value, but I also think that is too high. I am simply picked what I felt is a conservative number based on recent comparables, $480,000, and keep it for at least 6 months if not a year. This way, I just focus on the mortgage payoff, which I still plan to accomplish in 20 years at most.

You can view previous net worth updates here.

TradeKing: $50 Bonus For New Accounts

Online broker TradeKing has brought back their $50 sign-up bonus for new accounts, no referral required. You must open with $2,500 and make one trade within 30 days.

4) To qualify for this offer, new accounts must be opened and funded with $2,500 or more. Account funding must occur within 30 days of account opening, and one trade must be executed within 180 days of account opening, for account to qualify. Offer is not transferable or valid in conjunction with any other offer. Open to US residents only. One offer per household. TradeKing can modify or discontinue this offer at anytime without notice. The minimum funds of $2,500 must remain in the account (minus any trading losses) for a minimum of 6 months or the credit may be surrendered. Other restriction may apply.

TradeKing offers $4.95 trades with no minimum balance requirement. I’ve been using them for a while, they are a good basic broker. For more information, please check out my TradeKing Review.

Creating a Completely Automated Financial Household

Meet Bill and Jan. They are my imaginary couple that loves putting their personal finances on auto-pilot. They don’t worry about bill due dates, they never visit the bank, and only check their balances online once a month if there are no e-mail alerts sent to them. (Apparently they also don’t have lips or eyes, so it works well for them…) Let’s take a look at how they do it!

Income
Bill and Jan both elected to receive their regular income via direct deposit, so there are no checks to deposit. Even though Jan does some freelancing, she gets paid via PayPal, which she sets to automatically sweep any money into their bank account at the end of each business day. This feature is called Auto Sweep and is not heavily advertised, you must contact PayPal directly to enable it.

Long-Term Savings
Like everyone else, their 401(k) plans are funded via an automatic deferral each payday. For their Roth IRA, they simply take out $500 per month via an automatic transfer from their checking account for 10 months, which can be set up easily at Vanguard.com or any other major mutual fund provider. If you like individual stocks or ETFs, try automatic investing at ShareBuilder.

Short-Term Savings
For their annual vacation and other savings goals, they have an automatic transfer from their checking to an online savings account like the original Capital One Consumer Bank.

They do keep a certain buffer amount in their checking account, similar to this simple budgeting method. If the balance falls too low for any reason, an e-mail and text message alert are sent to both of them.

Housing
If they had a mortgage, most lenders will happily set up an automatic ACH from bank account each month. If they wanted to set up a biweekly payment plan and it isn’t free, they could simply take out 1/12th of their monthly mortgage payment each month automatically into Capital One 360. Once a year, they send one full mortgage payment to their lender.

If they rented, they would set their Online Billpay service to send a snail-mail check automatically each month and deduct the amount from the bank account.

Utilities
Most utility companies will allow to you sign up for them to automatically withdraw the full bill amount from your bank account. Contact them directly, and when available use your credit card to earn some extra rewards.

Insurance
Instead of dealing with large payments either annually or semi-annually, they have signed up for State Farm Payment Plan (SFPP), which groups their insurance premiums and divides them into one single monthly payment which is taken from their bank account. Check with your insurer to see if they have something similar.

Credit Card Bills
Most large credit cards issuers allow you to sign up a service like Citi’s AutoPay, where you can have the full amount sucked out of your bank account each month. Since the Citi Forward Card gives you 5x rewards on restaurants and Amazon.com, this most of their disposable income as well. To find it, go to CitiCards.com> (Login) > Payments Tab > Enroll in AutoPay.

What else?
With all this set up, all Bill and Jan have to do is show up for work and spend their money wisely. Is there anything else that could make their life even more easy? I thought about using an online grocery store like Peapod, where you can access past orders and possibly create default orders which you only tweak slightly each month.

Personal Rates of Return: Money Weighted vs. Time Weighted

There was a good question in my last retirement portfolio update about how my personal rate of return was 41% YTD, which was actually higher than any individual mutual fund in my portfolio*. The reason for this is mainly due to terminology, which can be especially confusing since the definitions seem to have shifted with time.

The two primary types are money-weighted and time-weighted returns, listed below with commonly associated names. Both have been called “personal rates of return” in the past.

Time-Weighted Returns Money-Weighted Returns
Reported returns
Portfolio returns
Investment returns
Geometric mean return
Dollar-weighted returns
Internal Rate of Return (IRR)

Time-Weighted Return Details
This methodology does not account for any cash inflows or outflows. In a way, finding your return using this method assumes that you don’t make any transactions at all. For a year-to-date calculation, it’s the same as asking how $100 invested on January 1st would end up today.

My favorite term for this method is Investment Return, because it essentially tracks the performance of your investments, and nothing else. If you have 30% US Stocks, 30% International Stocks, 30% Bonds, and 10% Orange Juice Futures, such a set of investments will have a unique performance from January 1st until today. Along the same lines, this time-weighted performance is what you get when looking up the total returns of a specific mutual fund (example). This also makes it easy to compare to a benchmark, such as the S&P 500 Index.

Money-Weighted Return Details
This methodology does account the size and timing of any cash inflows or outflows into your portfolio. Here’s an example of the difference. In your brokerage statements, look for any reference to accounting for “deposits and withdrawals”. Below is a chart of the S&P 500 index for all of 2009. Let’s say you started with $10,000 invested in the S&P 500 on January 1st. Then in early April before the tax deadline, you hurry and purchase $5,000 more worth.

As you might imagine, your $5,000 inflow was some good timing, and the performance of that money is a lot better (+25%) than the performance of your $10,000 from January 1st (+17%). If you managed to get your money in around March 9th, the return of that money year-to-date would be over 50%.

I prefer to call this methodology the Personal Rate of Return because it is truly personal. It is unlikely that any people have the exact same transaction amounts and dates as you. However, while this number may seem more accurate, it’s harder to compare against a benchmark and use for future investment decisions. As seen above, luck in the timing of your investments can swing the numbers either way.

I have an older post on how to calculate this dollar-weighted rate of return, but the Zohosheets aren’t displaying ideally right now. You can click on “Full Screen View” or try this page instead if you have Excel and the XIRR function installed.

What method do major investment firms use?
When Fidelity first started including “personal rate of return” in people’s 401(k) statements, it was a time-weighted rate of return. According to this 2000 LA Times article, Fidelity thought it was more appropriate to allow comparisons to published mutual fund numbers. At that same time, a spokesperson from Vanguard thought investors would be too confused either way, so they published nothing:

“We have several reservations about such reporting,” says Vanguard Group spokesman John Woerth. “Among them: Personal returns and fund returns are likely to differ, and perhaps substantially, which could confuse–even mislead–investors.”

How about today? When I checked my statements, both Fidelity and Vanguard use the money-weighted method for their “personal rate of return”. Our other 401(k) provider did as well, so it seems like things are shifting. I guess Vanguard thinks we’re smart enough to see the number now. 😉 In the end, as long as you understand the differences, I think both stats can be useful.

* This is mostly true, but actually my small allocation to an Emerging Markets fund (VEIEX) is up 60% YTD.

2009 Q3 Investment Portfolio Update – 9/21/09

2009 Q3 Portfolio Breakdown
 
Retirement Portfolio Actual Target
Asset Class / Fund % %
Broad US Stock Market ($64,794) 33.8% 34%
VTSMX – Vanguard Total Stock Market Index Fund
DISFX – Diversified Stock Index Institutional Fund*
FSEMX – Fidelity Spartan Extended Market Index Fund*
US Small-Cap Value ($17,554) 9.1% 8.5%
VISVX – Vanguard Small Cap Value Index Fund
Real Estate (REITs) $18,004 9.4% 8.5%
VGSIX – Vanguard REIT Index Fund
Broad International Developed $46,820 24.4% 25.5%
FSIIX – Fidelity Spartan International Index Fund*
International Emerging Markets $21,678 11.3% 8.5%
VEIEX – Vanguard Emerging Markets Stock Index Fund
Bonds – Short-Term $4,484 2.3% 3.8%
VFISX – Vanguard Short-Term Treasury Fund
Bonds – Inflation-Indexed $18,568 9.7% 11.3%
VIPSX – Vanguard Inflation-Protected Securities Fund
Total Portfolio Value $191,902
* denotes 401(k) holding given limited investment options.

Like many others, for most of this year I’ve just been trying to keep my head down, make my regular stock contributions like a good boy, and not looking at my statement balances too much! There’s been a lot of “wow, my portfolio isn’t so bad anymore” talk due to the recent market run, so I figured it was time for a checkup. You know of course, that this also means the market will tank today… 🙂

Contribution Details
So far in 2009, we have made the following contributions:

  • $5,000 x 2 for 2008 non-deductible IRA contributions
  • $5,000 x 2 for 2009 IRA contributions
  • $33,052 for both of our 401k contributions, including salary deferral and company match. One is maxed out, the other has a little left to go.

2009 Performance
In my last update back in April, I had found our year-to-date performance to be about -15%. According to my spreadsheet, the 2009 year-to-date dollar-weighted performance of our personal portfolio is now 41% YTD.

For reference, the Vanguard S&P 500 Fund (VFINX) has returned 20.52% YTD, their FTSE All World Ex-US fund (VFWIX) has returned 35.72% YTD, and their Total Bond Index fund (VBMFX) is 5.11% YTD as of 9/18/09. The Vanguard Target 2045 Fund (VTIVX) has returned 23.4% YTD, which as a similar stock/bond breakdown to our portfolio, but less international exposure. Part of the good relative performance (which was previously relatively poor) is also likely due due to the timing of my large lump-sum investments.

Investment Changes
We have used our new contributions to keep us close to our asset allocation target, with a 85% stocks/15% bonds split. Right now, we are not too far off. The target percentages for each asset class are shown above as well. Currently, with the run-up in equities, we are a bit underweight in bonds.

You can view all my previous portfolio snapshots here.