 Here’s my (late) quarterly update on the income produced by my “Humble Portfolio“. The total income goes up much more gradually and consistently than the number shown on brokerage statements (price), encouraging me as I keep plowing more of my savings into more stock purchases. I imagine them as a factory that just churns out more dollar bills.
Income yield history (percentage of portfolio value). Here is a chart showing how this 12-month trailing income rate has varied since I started tracking it in 2014. There appears to be a slight recovery from the early pandemic time period.

I track the “TTM” or “12-Month Yield” from Morningstar, which is the sum of the trailing 12 months of interest and dividend payments divided by the last month’s ending share price (NAV) plus any capital gains distributed over the same period. (ETFs rarely have to distribute capital gains.) I prefer this measure because it is based on historical distributions and not a forecast. Below is a rough approximation of my portfolio (2/3rd stocks and 1/3rd bonds).
| Asset Class / Fund | % of Portfolio | Trailing 12-Month Yield (Taken 1/24/22) | Yield Contribution |
| US Total Stock Vanguard Total Stock Market Fund (VTI, VTSAX) |
25% | 1.21% | 0.30% |
| US Small Value Vanguard Small-Cap Value ETF (VBR) |
5% | 1.75% | 0.09% |
| International Total Stock Vanguard Total International Stock Market Fund (VXUS, VTIAX) |
25% | 3.09% | 0.77% |
| Emerging Markets Vanguard Emerging Markets ETF (VWO) |
5% | 2.64% | 0.13% |
| US Real Estate Vanguard REIT Index Fund (VNQ, VGSLX) |
6% | 2.56% | 0.15% |
| Intermediate-Term High Quality Bonds Vanguard Intermediate-Term Treasury ETF (VGIT) |
17% | 1.14% | 0.19% |
| Inflation-Linked Treasury Bonds Vanguard Short-Term Inflation-Protected Securities ETF (VTIP) |
17% | 4.69% | 0.80% |
| Totals | 100% | 2.44% |
Stock dividends are the portion of profits that businesses have decided they don’t need to reinvest into their business. The dividends may suffer some short-term drops, but over the long run they have grown faster than inflation.
The ratio of dividend payouts to price also serve as a rough valuation metric. When stock prices drop, this percentage metric usually goes up – which makes me feel better in a bear market. When stock prices go up, this percentage metric usually goes down, which keeps me from getting too euphoric during a bull market.
Here’s a related quote from Jack Bogle (source):
The true investor will do better if he forgets about the stock market and pays attention to his dividend returns and to the operating results of his companies.
Absolute dividend history. Even though the dividend yield hasn’t been too impressive, there is a different story when you look at the absolute amount of income paid out over time. If you retired back in 2014 and have been living off your stock/bond portfolio, your total income distributions are much higher in 2022 than in 2014.
Here is the historical growth of the S&P 500 absolute dividend, which tracks roughly the largest 500 stocks in the US, updated as of Q4 2021 (via Yardeni Research):
This means that if you owned enough of the S&P 500 to produce an annual dividend income of about $13,000 a year in 1999, then today those same shares would be worth a lot more AND your annual dividend income would have increased to over $50,000 a year, even if you had spent every penny of dividend income every year.
Here is the historical growth of the absolute dividend of the EAFE iShares MSCI ETF, which tracks a broad index of developed non-US stocks (VXUS is a newer ETF), via Netcials.

European dividend culture seems to encourage paying out a higher percentage of earnings as dividends, but as a result those dividends are also more volatile, moving up and down with earnings. US dividend culture tends to be more conservative, with the expectation that dividends will be growing or at least stable. This is not true across every company, but in general there appears to be a greater stigma associated with dividend cuts in US stocks than in international stocks.
Big picture and rules of thumb. If you are not close to retirement, there is not much use worrying about decimal points. Your time is better spent focusing on earning potential via better career moves, improving in your skillset, and/or looking for entrepreneurial opportunities where you can have an ownership interest.
As a result, I support the simple 4% or 3% rule of thumb, which equates to a target of accumulating roughly 25 to 30 times your annual expenses. I would lean towards a 3% withdrawal rate if you want to retire young (before age 50) and a 4% withdrawal rate if retiring at a more traditional age (closer to 65). Build in some spending flexibility to make your portfolio more resilient in the real world, and that’s a reasonable goal to put on your wall.
Using the income before “full” retirement. Our dividends and interest income are not automatically reinvested. I treat this money as part of our “paycheck”. Then, as with a traditional paycheck, we can choose to either spend it or invest it again to compound things more quickly. Even if still working, you could use this money to cut back working hours, pursue a different career path, start a new business, take a sabbatical, perform charity or volunteer work, and so on. This is your one life and it only lasts about 4,000 weeks.
 Here’s my (late) quarterly update on my current investment holdings, as of 1/23/22, including our 401k/403b/IRAs and taxable brokerage accounts but excluding a side portfolio of self-directed investments. Following the concept of
 Instead of focusing on the current hot thing, how about stepping back and taking the longer view? How would a steady investor have done over the last decade? Most successful savers invest money each year over a long period of time.
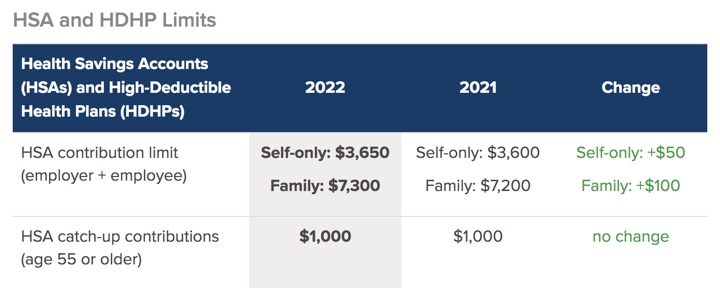
 The beginning of the year is a good time to check on the new annual contribution limits to the various available retirement accounts. Our income has been quite variable these last few years, so I regularly adjust the paycheck deferral percentages based on expected income for the year. This
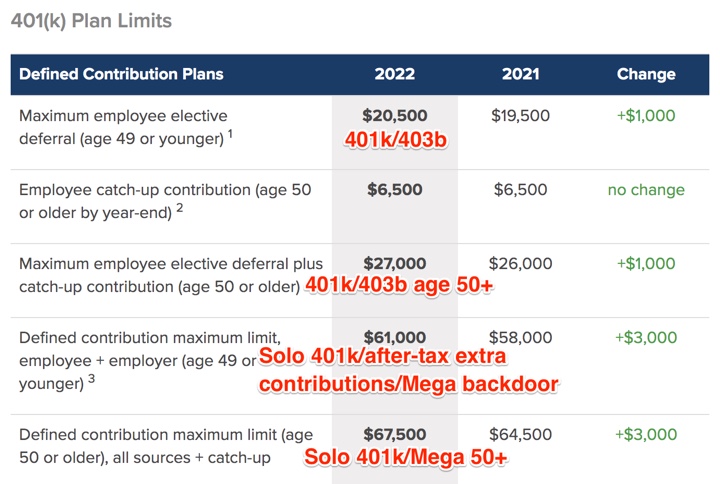


 Financial freedom seekers usually have a Number – the value at which their investments can support their spending indefinitely. This is directly linked to “safe withdrawal rates”. For example a 4% safe withdrawal rate is a 25x multiplier – meaning $30,000 in spending needs not covered by Social Security, annuities, or pensions would require 25 x $30,000 = $750,000. Morningstar recently released a 59-page research paper called


 Some investors like to break down their portfolio into several different asset and sub-asset classes. One long-standing example of the “slice-and-dice” is the “
 Savings I Bonds are a unique, low-risk investment backed by the US Treasury that pay out a variable interest rate linked to inflation. With a holding period from 12 months to 30 years, you could own them as an alternative to bank certificates of deposit (they are liquid after 12 months) or bonds in your portfolio.


 The Best Credit Card Bonus Offers – 2025
 Big List of Free Stocks from Brokerage Apps
 Best Interest Rates on Cash - 2025
 Free Credit Scores x 3 + Free Credit Monitoring
 Best No Fee 0% APR Balance Transfer Offers
 Little-Known Cellular Data Plans That Can Save Big Money
 How To Haggle Your Cable or Direct TV Bill
 Big List of Free Consumer Data Reports (Credit, Rent, Work)