MYGAs: Fixed Annuities with Higher, Guaranteed Rates Like CDs

I’ve been seeing a lot of articles about alternatives to traditional bonds and their ultra-low interest rates. The 5-year US Treasury rate is closer to zero than even 1%, an all-time low even considering the past decade (source):

Warnings about the dangers of chasing yield are for good reason. We need to be very skeptical. In a relatively quiet corner of the annuity world, you can get a “guaranteed” rate of 3% and above. This chart from Blueprint Income (via indexfundfan) shows the gap between the top 5-year MYGA rate and a 5-year Treasury, with a rate difference of 3.20% as of September 2020. The gap is slightly smaller as of this writing in late October 2020.

This is a huge gap if the level of safety is comparable. But is it? I actually bought a $10,000 MYGA contract back in 2015 as an educational investment, but never really wrote about it because it is relatively complex and I wasn’t sure it was worth the additional effort when the interest rate gap was much smaller. But given the growing gap, I think a DIY investor should consider at least learn about it as a potential part of their toolkit in 2020.

What are MYGAs? A “MYGA” is a form of fixed deferred annuity that offers a multi-year rate guarantee. For example, they may promise an annual interest rate of 3% for 5 years. This is similar to the rate guarantee from a bank certificate of deposit. However, there are several important differences between a MYGA and an FDIC-insured bank CD.

Annuities are bad though, right? Not all annuities are the same. I like the slogan of Stan “the Annuity Man” Haithcock: “Will do. Not Might do.” In others words, look for concrete promises with no wiggle room, not a “theoretical illustration based on historical returns”. A deferred annuity should state a fixed interest rate (ex. 3% for 5 years). A single-premium immediate annuity should promise you a fixed monthly income for the rest of your life (ex. $1,233 per month). Hard numbers, not a confusing formula based on the stock market (always quietly stripped of dividends).

Annuities also have a bad reputation because many have high commissions to encourage their sale. Often, the worse the annuity, the higher their commissions. However, MYGAs have relatively low commissions, often between 1% and 2.5% upfront (one-time) for the most competitively priced ones. On the flip side, many financial advisors won’t recommend an annuity because they don’t get paid an “assets under management” fee on them (which might be 1% every year, forever!).

Early withdrawal penalties. However, all annuities do have some complications to understand. Once you buy an annuity, you must keep it in an annuity and not withdraw until age 59.5, otherwise you will be subject to a 10% penalty on top of the taxes owed. It is a long-term commitment of funds, similar to an IRA contribution. However, after a 5-year MYGA contract expires, you can simply roll it over into another 5-year MYGA with the same or different provider. This is what I plan to do until I am past age 59.5. If you buy an MYGA with after-tax money, your interest gets to compound tax-deferred until you make a withdrawal. This can be helpful if you have already maxed out your IRA and 401k limits. (You could also convert to a single-premium immediate annuity with a guaranteed income stream.) Upon withdrawal, you will owe income tax on the gains (not principal).

Additional liquidity concerns. An early withdrawal before the end of your fixed term also will be subject to another large penalty, including a market-value adjustment and surrender charges. Some MYGA contracts allow small withdrawals, like 5% or 10% of the purchase amount per year. In general, this is not a good place for “emergency funds”.

“Guarantee”. This word is used frequently with insurance and annuity products. “Guaranteed income.” This only means it is “guaranteed” subject the claims-paying ability of the issuing insurance company. What happens if the insurance company can’t pay? This falls back onto the coverage limits of your state’s Life & Health Guaranty Association. From NOLHGA.com:

State guaranty associations provide coverage (up to the limits spelled out by state law) for resident policyholders of insurers licensed to do business in their state. NOLHGA assists its member associations in quickly and cost-effectively providing coverage to policyholders in the event of a multi-state life or health insurer insolvency.

When an insurer licensed in multiple states is declared insolvent, NOLHGA, on behalf of affected member state guaranty associations, assembles a task force of guaranty association officials. This task force analyzes the company’s commitments to policyholders; ensures that covered claims are paid; and, where appropriate, arranges for covered policies to be transferred to a healthy insurer.

The task force may also support the efforts of the receiver to dispose of the company’s assets in a way that maximizes their value. When there is a shortfall of estate assets needed to pay the claims of covered policyholders, guaranty associations assess the licensed insurers in their states a proportional share of the funds needed.

While the coverage limits vary from state to state, virtually all states offer at least $250,000 in coverage for the present value of an annuity contract. (Connecticut, New York, and Washington offer $500,000 in coverage. In California, the limit is only 80% not to exceed $250,000.) Look up your specific state’s limits here and here. Here is a reference chart (click to enlarge, source):

Unfortunately, this is not the same as being backed by the federal government, as with FDIC-insurance. It’s not even a state government backing, as only the member insurance companies have agreed to cover each other in cases of insolvency up to the policy limits. The guaranty system has not resulted in a loss to consumers within the limits since their inception in the 1980s, meaning it worked through the 2000 and 2008 market crashes. In order to be a licensed member of that association, you need to maintain a certain level of financial stability and under regular audits. Each individual insurer also rated by various agencies like AM Best, Moody’s, or Standard & Poors. In the end, there remains a possibility that an extremely large event could happen that would result in the inability of the stronger companies to help all the weaker ones. I recommend reading this paper about how the state guaranty system works in a failure.

It’s hard to put a number on the possibility of a partial loss even with this state guaranty system, but I’d definitely rather be covered with it than without. In this older 2013 post, I wrote about MYGAs and how to structure your accounts to stay within your state’s specific coverage limits.

Higher-rated insurers typically pay lower interest rates, and lower-rated insurers typically pay higher interest rates. There are different strategies on how to navigate this system. One is to decide on the lowest safety rating that you will accept, and then find the highest interest rate available with that minimum rating. Another is to simply trust in the state guaranty system and treat all the insurers as equal as long as you remain below the state-specific coverage limits. In that case, you simply buy the highest interest rate available from a licensed insurer.

If you are trying to understand what the ratings mean, first refer to the AM Best Ratings Guide [PDF], which states that “A Best’s Financial Strength Rating (FSR) is an opinion of an insurer’s ability to meet its obligations to policyholders.” followed by:

  • A++, A+. Assigned to insurance companies that have, in our opinion, a superior ability to meet their ongoing insurance obligations.
  • A, A-. Assigned to insurance companies that have, in our opinion, an excellent ability to meet their ongoing insurance obligations.
  • B++, B+. Assigned to insurance companies that have, in our opinion, a good ability to meet their ongoing insurance obligations.

I don’t know about you, but I would rate that as “Super Vague++”. Marginally more helpful is the fact that in the past, AM Best categorized the following as “Secure” : A++, A+ A, A- B++, B+. Anything below that fell to “Vulnerable”.

Here is another chart from AM Best that lists cumulative impairments over different time periods (via the Bogleheads forum):

It is important to note that an impairment does not necessarily mean that the insurer could not pay out the interest. It simply means that some sort of negative action was taken by a state regulatory agency. The insurer may be put under “administrative supervision” and may later exit while never missing any payments. Or, the insurer may be taken into conservatorship and the assets sold/transferred to a solvent insurer, again never missing any payments.

Again, I would spread out my MYGA contracts across multiple insurers and make sure the final size is well below your state’s contractual limits. For example, if the limit is $100k you put exactly $100k in a single contract at 3% interest for 5 years, at the end you’ll have over $115,000 and thus have $15k of your funds exposed.

Where do I buy a MYGA? I am not a insurance professional and I’ve probably missed some details. But I also get no commission if you buy one of these things. As a consumer, you should know the MYGA commission is baked inside and the upfront price is the same no matter who you buy it from. Back when I bought my MYGA in 2015, I did my own research and chose to buy from “Stan the Annuity Man”. You can find the MYGA section of his site here with rates for your specific state. I had a positive experience and would recommend him, especially if you prefer to have a reliable person-to-person relationship with good communication. I am not affiliated with Stan, other than being a satisfied customer. In 2020, there are more “fintech” options including the Blueprint Income marketplace. Both of those websites are have an educational section with more information about MYGAs in general.

At the end of your MYGA contract, you will have short (30-day?) window where you can make a 1035 transfer to another annuity provider (or renew with the same provider at prevailing rate). I was given plenty of heads up by The Annuity Man team. Again, the price should be same no matter where you buy it, so I would pick the place you think you’ll get better customer service. It might even be a local broker.

Bottom line. This is a brief introduction to a unique annuity product called the MYGA (multi-year guaranteed annuity) that offers a fixed, tax-deferred yield that may be significantly higher than that of other investment-grade bonds like US Treasuries. There are many important factors to understand, including insurer stability ratings, state guaranty limits, liquidity rules, and surrender charges. I’ve probably overlooked something as well. MYGAs are best if you are a motivated DIY investor looking for higher-yielding fixed-income investments and have maxed out your other tax-deferred options like IRAs and 401(k) plans.

What Really Matters In Your Personal Finances

The best sentence about personal finance that I’ve read this week is from Beware of Financial Alchemy by Adam Collins of Movement Capital.

There are only a few things you can control that have a big impact on your finances:

If you’re young, how much you save
If you’re retired, how much you spend
How you behave when markets panic
Your allocation between stocks and bonds
How much you pay in fees

Everything else is a rounding error. The issue is we tend to focus on the rounding errors.

That’s exactly right. I write a lot about rounding errors because otherwise I’d just be saying the above sentence over and over again. Writing about personal finance often boils down to a game where you have to talk about the same 5-10 topics but manage to put a different spin on them so it feels fresh.

However, I try to focus on rounding errors that have a very high probability of helping you out without harming you. A little higher yield on an FDIC-insured bank account. A little more cash back on your existing credit card purchases. A little higher net return through lower cost index funds and no-commission-fee brokerage firms (or those that pay you to move over some assets). Piling on a few more data points on market drops to keep you in the long-term mindset. But don’t get scammed by someone promising what is simply too good to be true:

The truth about investing in 2020 is there isn’t an easy fix for high stock valuations and low bond yields. No strategy can magically transform today’s low return opportunity set into a high return future. So what can you do? Focus on what you can control and don’t get tempted by someone promising they can turn lead into gold.

Savings I Bonds November 2020 Interest Rate: 1.68% Inflation Rate, 0% Fixed

Update November 2020. The fixed rate will be 0% for I bonds issued from November 1, 2020 through April 30th, 2021. The variable inflation-indexed rate for this 6-month period will be 1.68% (as was predicted). If you buy a new bond in between November 2020 and April 2021, you’ll get 1.68% for the first 6 months. Don’t forget that the purchase limits are based on calendar year, if you wish to max out for 2020. See you again in mid-April for the next early prediction for May 2021.

Original post:

sb_posterSavings I Bonds are a unique, low-risk investment backed by the US Treasury that pay out a variable interest rate linked to inflation. With a holding period from 12 months to 30 years, you could own them as an alternative to bank certificates of deposit (they are liquid after 12 months) or bonds in your portfolio.

New inflation numbers were just announced at BLS.gov, which allows us to make an early prediction of the November 2020 savings bond rates a couple of weeks before the official announcement on the 1st. This also allows the opportunity to know exactly what a October 2020 savings bond purchase will yield over the next 12 months, instead of just 6 months. You can then compare this against a November 2020 purchase.

New inflation rate prediction. March 2020 CPI-U was 258.115. September 2020 CPI-U was 260.280, for a semi-annual increase of 0.84%. Using the official formula, the variable component of interest rate for the next 6 month cycle will be 1.68%. You add the fixed and variable rates to get the total interest rate. If you have an older savings bond, your fixed rate may be very different than one from recent years.

Tips on purchase and redemption. You can’t redeem until 12 months have gone by, and any redemptions within 5 years incur an interest penalty of the last 3 months of interest. A simple “trick” with I-Bonds is that if you buy at the end of the month, you’ll still get all the interest for the entire month as if you bought it in the beginning of the month. It’s best to give yourself a few business days of buffer time. If you miss the cutoff, your effective purchase date will be bumped into the next month.

Buying in October 2020. If you buy before the end of October, the fixed rate portion of I-Bonds will be 0%. You will be guaranteed a total interest rate of 0.00 + 1.06 = 1.06% for the next 6 months. For the 6 months after that, the total rate will be 0.00 + 1.68 = 1.68%.

Let’s look at a worst-case scenario, where you hold for the minimum of one year and pay the 3-month interest penalty. If you theoretically buy on October 31st, 2020 and sell on October 1, 2021, you’ll earn a ~1.04% annualized return for an 11-month holding period, for which the interest is also exempt from state income taxes. If you theoretically buy on October 31st, 2020 and sell on February 1, 2022, you’ll earn a ~1.10% annualized return for an 15-month holding period. Comparing with the best interest rates as of October 2020, you can see that this is slightly higher than a current top savings account rate or 12-month CD.

Buying in November 2020. If you buy in November 2020, you will get 1.68% plus a newly-set fixed rate for the first 6 months. The new fixed rate is unknown, but is loosely linked to the real yield of short-term TIPS. In the past 6 months, the 5-year TIPS yield has been consistently negative! My confident guess is that it will be zero (0%). Every six months, your rate will adjust to your fixed rate (set at purchase) plus a variable rate based on inflation.

If you have an existing I-Bond, the rates reset every 6 months depending on your purchase month. Your bond rate = your specific fixed rate (set at purchase) + variable rate (total bond rate has a minimum floor of 0%).

Buy now or wait? The fixed rate is most likely going to be zero for October and November purchases, and so I would personally wait until November and get the 1.68% inflation and unknown inflation rate after that, betting that it will be higher than 1.06%. Either way, it seems worthwhile to use up the purchase limit for 2020 as the rates will at least be slightly higher than other cash equivalents.

Unique features. I have a separate post on reasons to own Series I Savings Bonds, including inflation protection, tax deferral, exemption from state income taxes, and educational tax benefits.

Over the years, I have accumulated a nice pile of I-Bonds and now consider it part of the inflation-linked bond allocation inside my long-term investment portfolio.

Annual purchase limits. The annual purchase limit is now $10,000 in online I-bonds per Social Security Number. For a couple, that’s $20,000 per year. Buy online at TreasuryDirect.gov, after making sure you’re okay with their security protocols and user-friendliness. You can also buy an additional $5,000 in paper I bonds using your tax refund with IRS Form 8888. If you have children, you may be able to buy additional savings bonds by using a minor’s Social Security Number.

For more background, see the rest of my posts on savings bonds.

[Image: 1946 Savings Bond poster from US Treasury – source]

Three Pillars of Self-Determination: Autonomy, Competence, and Community

After reading the book Sapiens about how the history of our species affects our everyday experience, I found the related book Tribe: On Homecoming and Belonging by Sebastian Junger. Again, our genetic material hasn’t had enough time to change much from a human living 10,000 years ago, when all humans roamed together in nomadic bands of around 30-50 people. Humans today still retain a strong instinct to belong to such small, social groups that work together toward a common purpose – “tribes.”

What happens we can’t live in tribes anymore? Why does living in our modern, affluent society actually lead to higher rates of depression and suicide?

First agriculture, and then industry, changed two fundamental things about the human experience. The accumulation of personal property allowed people to make more and more individualistic choices about their lives, and those choices unavoidably diminished group efforts toward a common good. And as society modernized, people found themselves able to live independently from any communal group. A person living in a modern city or a suburb can, for the first time in history, go through an entire day—or an entire life—mostly encountering complete strangers. They can be surrounded by others and yet feel deeply, dangerously alone.

In contrast, when a large-scale catastrophe occurs, rates of depression and suicide actually drop for a while, perhaps because we again feel united and connected with others.

[Researcher Fritz] was unable to find a single instance where communities that had been hit by catastrophic events lapsed into sustained panic, much less anything approaching anarchy. If anything, he found that social bonds were reinforced during disasters, and that people overwhelmingly devoted their energies toward the good of the community rather than just themselves.

The book includes many examples of how this need for true community is behind many societal problems. This also fits in with self-determination theory:

The findings are in keeping with something called self-determination theory, which holds that human beings need three basic things in order to be content: they need to feel competent at what they do; they need to feel authentic in their lives; and they need to feel connected to others. These values are considered “intrinsic” to human happiness and far outweigh “extrinsic” values such as beauty, money, and status.

Here how Wikipedia describes these three pillars:

  • Autonomy – Desire to be causal agents of one’s own life and act in harmony with one’s integrated self. (This does not mean you want to be alone.)
  • Competence – Seek to control the outcome and experience mastery.
  • Relatedness (Community) – Will to interact with, be connected to, and experience caring for others.

We want to help others. We are perfectly willing to sacrifice to do so. But we also want to be in a trusted group that would also risk themselves to help us. These smaller groups that extend past your nuclear family are a common element of Blue Zones.

What would you risk dying for—and for whom—is perhaps the most profound question a person can ask themselves.

A lighter version might be, how many people do you know that would be willing to commit real, significant sacrifice to help each other?

In the big picture, our country is struggling because we don’t feel united as one team. In the small picture, this is a critical part of “retirement planning”. Many people derive both competence and community from their work, and you will have to replace that to create a happy post-work life. (Similarly, if you hate your work, you probably don’t find community and competence there.)

Schwab Plan Review: Free DIY Financial Planning Software

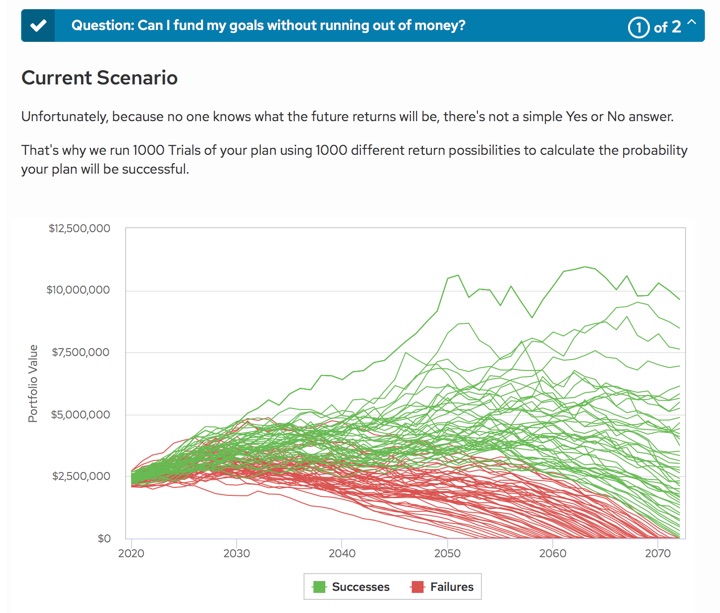
Schwab has rolled out a new digital financial planning tool called Schwab Plan. They claim it to be a simplified version of the same financial planning software used by many human financial advisors. From their press release:

Schwab Plan is a digital self-guided financial plan available through Schwab.com that helps investors build a personalized plan that includes a range of factors such as desired retirement age, retirement goals, social security expectations, portfolio risk profile and asset allocation, and various income sources.

[…] they are able to generate a retirement plan that shows retirement goals and probability of funding those goals, a comparison of an individual’s current asset allocation to a recommended allocation based on plan inputs, and suggested next steps to get and stay on track.

Access to this tool is free to anyone with any type of Schwab account. (Eventually, this should include TD Ameritrade clients as well.) There is no minimum asset requirement and you don’t need to sign up for a new service. For example, I was able to access it with only a Schwab PCRA brokerage window account. Here are a few initial impressions and screenshots after testing it out.

First, you enter some basic personal information like current age, gender, retirement age, and life expectancy:

Next, you estimate your income needs in retirement. They offer additional assistance in estimated your health insurance costs in retirement. You then enter your assets and income sources. Your Schwab accounts are automatically imported, and you can manually add the raw balances of additional external accounts (no account aggregation). They use your information to estimate your Social Security income, and also ask about stock options and restricted stock units.

(They don’t ask about children, college savings, term life insurance, disability insurance, or any of those smaller details that a full-service advisor would ask about. There is also very little customization available in terms of recognizing your external asset allocations.)

Once everything is entered, they run a Monte Carlo simulation to estimate your probability of success.

You can then adjust the variables, such your retirement age and future spending, in order to see how it affects your success rate. I found the analysis to be reasonably consistent with my other research, and I liked that the results changed significantly for an early retirement (45 year period) as opposed to a traditional retirement (30 year period). They use a “confidence zone” system:

(The Monte Carlo simulations above does not equate to an 86% confidence level. This was after making some tweaks to improve the results.)

Bottom line. Schwab has added a free financial planning tool for all of their customers (no minimum asset requirement). After testing it out, it is not quite “professional-grade”, but I did find it to be slightly more advanced than most other free options. I would recommend trying it out if you have any type of Schwab account. Of course, it also provides a pathway to upgrade to their other portfolio management services, and I still have concerns about their Intelligent Portfolios product.

Rational Expectations: Advanced, Specific, Practical Portfolio Advice

The fourth and final book in the “Investing for Adults” series by William Bernstein is Rational Expectations: Asset Allocation for Investing Adults. In Book 1: The Ages of the Investor, I learned to take advantage of a lucky streak in stocks and stop when I’ve won the game. In Book 2: Skating Where the Puck Was, I learned why it’s so hard to find any “new and improved” asset classes. In Book 3: Deep Risk, I learned about the scenarios that have led to permanent capital loss.

This final book includes the most specific advice about constructing your retirement portfolio. The entire series is great (and honestly not very long even read back-to-back), but this final book is especially dense with additional practical ideas for those that are already comfortable with investing basics. This isn’t at all scientific, but upon counting my Kindle highlights, Book 4 had 75 highlighted passages vs. 33, 25, and 36 respectively for Books 1-3. I’m only going to touch on the few that directly impacted my own portfolio construction.

Stocks. Here is an excerpt regarding how much of your portfolio should be allocated to international stocks.

Deployment among stock asset classes is relatively easier. The obvious place to start is with the total world stock market, as mirrored reasonably well by the FTSE Global All Cap Index, which in early 2014 was split 48/52 between U.S. and foreign equities. From there, we make three adjustments to the foreign allocation, two down and one up. First, the downs: if you’re like most people, your retirement liabilities will be in dollars, so a 52% foreign allocation is inappropriately high. Second, foreign stocks not only are slightly more difficult and expensive to trade but also are subject to foreign tax withholding. This presents no problem in taxable accounts, since those taxes will offset your liability to the IRS, but you lose that deduction if you hold foreign stocks in a sheltered account.

The up adjustment is a temporary one, since foreign stocks, as was discussed in chapter 1, currently have higher expected returns. So at the time of this writing, a foreign stock allocation somewhere in the 30% to 45% region seems reasonable.

Simplifying all that, as of early 2014, the middle recommendation would be roughly 60/40 US/international while the world market cap weighting was roughly 50/50. A little home bias is recommended for US investors.

As of mid-2020, the world market cap weighting is 57% US and 43% International (source), which you might round to 60/40. The adjustments are mostly the same, except that foreign stocks probably have even slightly higher future expected returns as the US stocks keep climbing. If you want to maintain a slight home bias, I would speculate this might change the recommended range closer to 65/35 or 70/30?

Bonds. The recommended list includes short-term US Treasuries/TIPS, bank CDs, and investment-grade municipal bonds. Bernstein is not a fan of corporate bonds.

Sooner or later, we’re going to have an inflationary crisis, and in such an environment, long duration will be a killer. Stick to short Treasuries, CDs, and munis.

Own municipal bonds via a low-cost Vanguard open-ended mutual fund for the diversification. Own Treasury bonds and TIPS directly, as there is no need for mutual funds or ETFs since they all have the same level of risk. Own bank CDs and credit union certificates under the FDIC and NCUA insurance deposit limits.

Asset location. I found this advice about spreading your holdings across Traditional IRAs, Roth IRAs, and taxable accounts to be very useful and practical. Importantly, this may be somewhat different that what you have read elsewhere. I don’t want to summarize incorrectly, so I will just use the excerpts:

To the extent that you wish to rebalance the asset classes in your portfolio, all sales should be done within a sheltered account. If possible, you should house enough of each stock asset class in a sheltered account so that sales may be accomplished free from capital gains taxes. Next, all of the REIT allocation certainly belongs in the sheltered portfolio, since the lion’s share of their long-term returns come from nonqualified dividends.

The real difference made by location occurs at the level of overall account returns. In terms of tax liability, Traditional IRA/Defined Contribution > Taxable > Roth IRA. This means that, optimally, you’d like to arrange the expected returns of each account accordingly, with the highest returns (i.e., highest equity allocation) optimally occurring in the Roth, and the lowest returns (i.e., lowest stock allocation) in your Traditional IRA/Defined Contribution pool. To the extent that this is true, it conforms with the stocks-in-the-taxable-side argument. That said, for optimal tax-free rebalancing, unless your Roth IRA is much bigger than your traditional IRA, you’re still going to want some stock assets in the latter.

It is definitely nice to be able to rebalance and not have to worry about picking stock lots, making sure you have the right cost basis at tax time, and paying capital gains taxes.

Protecting Your Portfolio From Hyperinflation, Deflation, Confiscation, and Devastation

The third book in the “Investing for Adults” series by William Bernstein is Deep Risk: How History Informs Portfolio Design. As before, I’m just trying to pull out a few practical takeaways rather than summarize the entire book. In Book 1: The Ages of the Investor, I learned to take advantage of a lucky streak in stocks and stop when I’ve won the game. In Book 2: Skating Where the Puck Was, I learned why it’s so hard to find any “new and improved” asset classes.

The main problem addressed in this book is “deep risk”, the permanent loss of real (inflation-adjusted) capital. This contrasts with “shallow risk”, in which the value of something usually rebounds within 5-7 years or less.

Here are some deep risks that you can offset by purchasing insurance (and be happy if you never have to use it!).

  • Death of income earner.
  • Long-term health disability.
  • Legal risk – lawsuit with large judgment.
  • Select types of asset loss (i.e. theft, building fire).

Unfortunately, there are other deep risks against which you can’t buy insurance.

  • Hyperinflation, prolonged and severe.
  • Deflation, prolonged and severe.
  • Confiscation by government.
  • Devastation (war).

Over an extended period of time, history has shown us that “safe” bonds are often more sensitive to deep risk than stocks. Many countries saw 100% losses for their bondholders, while partial ownership in a business survived wars and regime changes. An example given was in Germany after World War II. Bonds are also at risk for inflation, while a 30-year fixed-rate mortgage (a negative bond) can be a great inflation hedge.

A portfolio of internationally-diversified stocks is the most practical way to protect yourself from both inflation and deflation. Historically, inflation is much more likely than deflation. You might have an event in one country, but it would be very rare to have a large majority of nations experience severe inflation and low stock returns all at the same time. In such a case you’d be looking at global devastation.

As for local confiscation and local devastation, you would be looking at foreign-held assets, foreign property, perhaps the right passports, and a plan to escape in a timely manner. This sounds like something that a billionaire might pay someone else to set up, but not so sure how practical it would be for most people.

Bernstein offers his own summary:

This booklet’s primary advice regarding risky assets is loud and clear: your best long-term defense against deep risk is a globally value-tilted diversified equity portfolio, perhaps spiced up with a small amount of precious metals equity and natural resource producers, TIPS, and, if to your taste, bullion and foreign real estate.

I admit that I am somewhat fascinated by worst-case scenarios, and I recommend reading the entire book for the full discussion. But in the end, my primary takeaway is that if you have a globally-diversified stock portfolio, you’ve done most of what you can in terms of deep risk. The rest is the same advice as before: consider TIPS if you have enough money, maximize Social Security, and keep some nice safe bonds and bank CDs for short-term needs (shallow risk).

Free Social Security Tool for Optimal Benefit Claiming Strategy

Update: The free Open Social Security tool has been updated to include a new “heat map” visualization that illustrates the relative values of claiming Social Security at different ages. Details here. Here is a sample graph for a couple with similar income histories and the same age:

For this situation, we see that the worst expected outcomes would occur if both individuals claimed really early. The best expected outcomes occur when one claims relatively early and the other claims relatively late.

Original post:

socialsecuritycardWhen to start claiming Social Security to maximize your potential benefit can be a complicated question, especially for couples. There are multiple paid services that will run the numbers for you, including Social Security Solutions (aka SS Analyzer) and Maximize My Social Security, which cost between $20 and $250 depending on included features.

Mike Piper of Oblivious Investor has created a free, open-source calculator called Open Social Security. To use the calculator, you will need to your Primary Insurance Amount (PIA). This amount depends on your future income, so I would first consult this other free Social Security benefit estimator tool to more easily estimate your PIA. I believe the value you see at SSA.gov assumes that you will keep working at your historical average income until your claiming age (which won’t be the case for us).

Here are our results as a couple, assuming we were the same age (we are close) and with my expected benefit being slightly higher than hers:

The strategy that maximizes the total dollars you can be expected to spend over your lifetimes is as follows:

You file for your retirement benefit to begin 12/2047, at age 70 and 0 months.
Your spouse files for his/her retirement benefit to begin 4/2040, at age 62 and 4 months.

The present value of this proposed solution would be $657,749.

Basically, the tool says that my wife should apply as soon as possible, while I should claim as late as possible. I believe this is because this scenario allows us claim at least some income starting from 62, and if I die first after that, my wife would still be able to “upgrade” to my higher benefit.

The tool might take some time to run the calculations, depending on your browser. You can learn more and provide feedback at Bogleheads and Github.

I am not a Social Security expert, and am not qualified to speak to the accuracy of the results. However, Mr. Piper is the author of the highly-rated book Social Security Made Simple, has a history of doing thorough work, and the tool has been around a while now. If I were close to 62, I would probably also use the paid services for a second and third opinion. Why? Spending $100 now could save you many thousands in the future.

The best thing about this free tool is that it can introduce a lot of people to ideas that they would have not otherwise considered. Even if it lacks every bell or whistle, being free means it can help more people. Many spouses wouldn’t think of having one claim as early as possible (age 62), and then have the other claim as late as possible (age 70). It’s not common sense unless you understand the inner workings of Social Security.

The Money Hamster Wheel, Part 2: Multiple Solutions, Not Just More Money

In Part 1: Identifying the Problem, I shared Lawrence Yeo’s unique take on money and the hamster wheel metaphor, where we just keep spinning and can’t get off. Since then, I have thought more about how best to slow things down by instead attacking each step of the cycle. To be honest, I don’t know if I can properly explain Yeo’s concepts, so I came up with my own version of the hamster wheel. Here it is, rather hastily-drawn:

A common criticism of seeking financial freedom is that it’s all about money. Make more money. Spend less money. However, if you take a step back, money is just part of the flow between how you spend the time in your life. How are you making that money? Why do you want more money? Why are you spending the money?

Accordingly, here various ways that someone could lessen the impact of each part of the cycle.

  • Find better-paying work that is equally fulfilling and stimulating. Try to save the excess. Don’t make yourself more unsatisfied for more money.
  • Find more fulfilling and stimulating work, even if it pays less. Be happier, and thus need to spend less to replace that happiness.
  • Engage in non-work activities that provide meaning and stimulation. If you need a better job, work on a new skill. If you need more stimulation, start a side business and keep your current job. Or just find a new hobby/sport/language. Taking action is the key, as the right activities will energize you.
  • Reduce your intake of low-quality media. Stop consuming things that make you feel worse about yourself. The wrong activities will drain you, which encourages more spending.
  • Exercise more (try outdoors or with other people) and eat better food. This gives you more energy all day long.
  • Spend less money on the things that don’t matter, so you need less money. Cut out the mindless and unhelpful spending.
  • Spend more money on the things that truly matter to you. Now that you cut the mindless, you can spend more on improving interpersonal relationships, or energizing activities (see above).
  • The more you learn to control this cycle, the more you can use the concept of “Enough” to widen the gap between money in and money out. Decouple earning and spending. Invest in enough productive assets so that your required income is less and less.

Addressing the problem from one angle, helps free you up to attack it from another angle later. For example, if you eat and exercise better, you might have enough energy to take corrective action, and not just fantasize about that side business when you really just turn on the TV after a long day at work.

The Money Hamster Wheel, Part 1: Identifying The Problem

I started looking into financial independence because I simply couldn’t imagine doing what I was doing every weekday at that time for another 30 or 40 years. Some people know exactly what they want to spend their life doing, and it also pays the bills and then some. I was always envious of those folks. Strangely, I never really felt that making more money was the final answer. I saved diligently in order to quit my job and go back to school and explore alternate paths.

This week, I’ve been pondering a longread by Lawrence Yeo about his philosophy of money at How Money Forever Changed Us. It’s a very high-level exploration of how money both solves and causes various conflicts in our lives. This culminates into what he calls the Money Hamster Wheel:

The questions posed are slightly different than you may have seen elsewhere. Does working a job that doesn’t fulfill our need for purpose and meaning really take something away from our identity? Is that identity loss what we are really trying to replace by spending money? Why is it so rare to find people that are truly happy and aligned with their work and the rest of their lives?

You’ll have to read the entire article to understand all the spokes of his wheel (although I’m still not sure I do completely), and while Yeo admits that it is not possible to fully “get off the wheel”, you can do something:

When I look at each spoke on the wheel, I view them as potential opportunities to slow the whole thing down. If we are aware of each mechanism, we can notice when we’re operating under them, and lessen their impact in turn.

The hamster wheel is a great metaphor. Over time, I’ve accepted that financial independence will always be rare. I used to think that higher income = more wealth = more stability. But then I noticed that certain things don’t change when people make $75k vs. $150k vs. $300k a year. The neighborhood changes. The car changes. Yes, even average net worth changes (but rarely enough to 33x expenses before age 65). Unless they hit a huge windfall in the multi-millions, most of them will work until they are 65 or older. Most will say they like their job okay, but they would never do it for a 25% pay cut. Most will never be able to handle an extended period of unemployment. Earn more, spend more. Still spinning on the wheel. Maybe that’s just how it’s meant to be? Yeo presents a solution:

But if we take the time to look closer, we’ll see that a middle-ground exists. A place where our fears could be calmed, and our desires could be curtailed. A place where the quest for money falls only to what is essential.

In a world where neither scarcity nor abundance will do, perhaps the closest solution to the great paradox comes down to one principle:

The ability to recognize when we have enough.

Sounds easy, but shockingly hard. “Enough” is not encouraged in our culture. I still struggle with it as well, or at least I’m afraid I won’t be able to keep up the fight forever.

In Defense of Working One More Year (OMY)

In early retirement discussion forums, you’ll often see the term OMY, which refers to people who have reached their calculated retirement savings target, but decide to keep working “One More Year”. Sometimes that one more year becomes two more years, three more years, and so on. This leads to OMY being seen as an irrational behavioral quirk like hedonic adaptation. However, are the potential benefits of working one more year being under-appreciated?

In the Medium article How important is asset allocation versus withdrawal rates in retirement?, EREVN (he lives in Vietnam) compares the power of picking the optimal asset allocation vs. saving more money. Investors often worry about whether they own the right mix of stocks and bonds. Do you own enough stocks, as to get a high enough return? Do you own enough bonds, so you don’t freak out during a market drop?

EREVN points out that historically, the optimal asset allocation in terms of having your portfolio last the longest is almost always 100% stocks. (98% of the time.) Even including the other 2%, how much of a benefit is it to hold the optimal asset allocation?

Read the entire article for full understanding of the assumptions taken, but here is the summary of his experiments. We usually optimize asset allocation based on highest return, but that’s not exactly the same as withdrawal rate. Note: Whenever you see “4% withdrawal rate”, that’s the same as having 25 times your annual expenses. 3% withdrawal rate = 33.3x expenses, 2% withdrawal rate = 50x expenses, etc. I added the stuff in the brackets [].

Even with perfect hindsight, choosing the best possible asset allocation is only equivalent to going from a 4% withdrawal rate to a 3.7% or 3.8% withdrawal rate. [25x expenses to 26x or 27x expenses.] In other words, saving 1 or 2 extra years of expenses dominates getting the asset allocation decision perfectly correct. In reality, we don’t have perfect hindsight and our asset allocation will be sub-optimal.

The powerful conclusion:

Instead of stressing about trying to pick “the right” asset allocation, you’re better off picking anything reasonable and ignoring every other asset allocation internet discussion for the rest of your life… and then working an extra six or twelve months to pad out your retirement fund before retiring.

I like the paring of working one more year and being able to drop the worry about asset allocation now and forever! You don’t want to work forever, but this does make OMY have multiple benefits (existing portfolio can grow another year, might even save more, stop worrying about asset allocation).

Here are a few related posts on “Saving More vs. XXX” from the archives:

Image via GIPHY.

William Bernstein and Safe Withdrawal Rates

A recurring theme in investing is that you start out learning the simple basics, then you feel like you can optimize things and spend a lot of effort trying to do so, and eventually you realize that simple is probably just fine. No matter how closely you mine the past, you can’t predict the future. As the Buffett quote goes, “If past history was all there was to the game, the richest people would be librarians.” That’s what came to mind when I read William Bernstein on safe withdrawal rates in retirement:

Even the most sophisticated retirement projections contain so much uncertainty that the entire process can be summarized as follows: Below the age of 65, a 2% spending rate is bulletproof, 3% is probably safe, and 4% is taking chances. Above 5%, you’re taking an increasingly serious risk of dying poor. (For each five years above 65, add perhaps half of a percentage point to those numbers.)

Source: The Ages of the Investor: A Critical Look at Life-cycle Investing.

Something to keep in mind when you become obsessed about getting from a 98% success rate to a 99% success rate on a simple retirement calculator from Vanguard or a fancy one like FIRECalc. (Not that I’ve done that, ever, of course…)