I am re-reading a series called “Investing for Adults” by William Bernstein. By “Investing for Adults”, Bernstein means that he assumes that you already know the basics of investing and that he can skip to more advanced insights. There are four parts:
- The Ages of the Investor: A Critical Look at Life-cycle Investing
- Skating Where the Puck Was: The Correlation Game in a Flat World
- Deep Risk: How History Informs Portfolio Design
- Rational Expectations: Asset Allocation for Investing Adults
A commonly-cited part of the first book The Ages of the Investor is the question “Once you have won the game, why keep playing?”. If you have enough money to buy a set of safe assets like inflation-adjusted annuities, delayed (and thus increased) Social Security payments, and a TIPS ladder to create enough income payments for life, you should seriously considering selling your risky assets and do exactly that. (This is referred to as a liability-matching portfolio, or LMP. You can keep investing any excess funds in risky assets, if you wish.)
A wrinkle to this plan is that you won’t know exactly when the stock market will help make that happen. Before you reach your “number”, you’ll most likely be buying stocks and hoping they grow in value. Let’s say you saved 20% of your salary and invested it in the S&P 500*. How long would it take you to “win the game”?
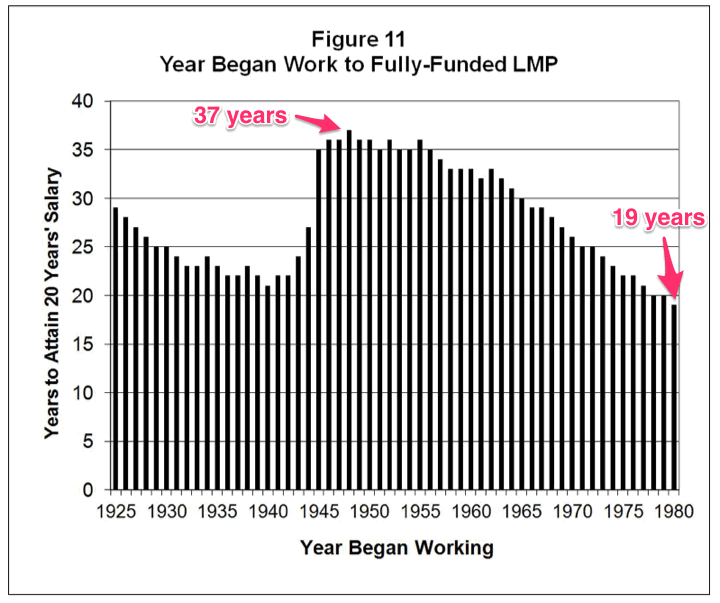
Historically, it could be as little at 19 years or as long as 37. That’s nearly a two-decade difference in retirement dates! Same savings rate, different outcomes.
This paradigm rests on too many faulty assumptions to list, but it still illustrates a valid point: You just don’t know when you’re going to achieve your LMP, and when you do, it’s best to act.
If, at any point, a bull market pushes your portfolio over the LMP “magic number” of 20 to 25 times your annual cash-flow needs beyond Social Security and pensions, you’ve won the investing game. Why keep playing? Start bailing.
If you don’t act, the market might drop and it could take years to get back to your number again. This is one of the reasons why some people should not be holding a lot of stocks as they near retirement. Some people might need the stock exposure because the upside is better than the downside (they don’t have enough money unless stocks do well, or longevity risk), but for others the downside is worse than the upside (they DO have enough money unless stocks do poorly, or unnecessary market risk).
I find the concept of a risk-free liability-matching portfolio (LMP) much harder to apply to early retirement, as it is nearly impossible to create a truly guaranteed inflation-adjusted lifetime income stream that far into the future. Inflation-adjusted annuities are rare, expensive, and you’re betting that the insurer also lasts for another 50+ years if you’re 40 years old now. Social Security is subject to political risk and may become subject to means-testing. TIPS currently have negative real yields across the entire curve, and only go out to 30 years. (As Bernstein explores in future books, you’ll also have to avoid wars, prolonged deflation, confiscation, and other “deep risk” events.)
* Here are the details behind the chart:
As a small thought experiment, I posited imaginary annual cohorts who began work on January 1 of each calendar year, and who then on each December 31 invested 20% of their annual salary in the real return series of the S&P 500. I then measured how long it took each annual cohort, starting with the one that began work in 1925, to reach a portfolio size of 20 years of salary (which constitutes 25 years of their living expenses, since presumably they were able to live on 80% of their salary). Figure 11 shows how long it took each cohort beginning work from 1925 to 1980 to reach that retirement goal.


 The 2020 Berkshire Hathaway Annual Shareholder Meeting was on May 2nd, 2020 and is now available as a recorded video on

 Scott Burns of the Dallas News is known for his “Couch Potato Portfolios”. These are literally the simplest, laziest, easiest portfolios that you will ever see. The Basic Couch Potato Portfolio is 50% Total US Stock and 50% Total US Bond funds/ETFs. The Margarita version is 1/3rd US Stocks, 1/3 International Stocks, and 1/3 Bonds. Can’t get much easier to remember than that! You may be surprised at how well they have performed despite their simplicity.
 It might be a little painful, but it may be worthwhile to check on your pre-tax IRAs during this dip. If you have been thinking of converting your “Traditional” IRAs over to Roth IRAs, your shrunken gains will lead to a smaller tax bill now, while your (hopefully) future gains from this point onward will be tax-free after 5 years and age 59.5.
 If you are living paycheck-to-paycheck, by definition you aren’t saving and buying any assets. The folks who do have assets, those assets keep growing and compounding away. Left alone, that gap just widens relentlessly. Meanwhile, building up assets from nothing can feel agonizingly slow in the beginning.

 The last 10 years of stock market returns have been pretty remarkable. If you invested $100,000 in the S&P 500 in the year 2000 and held it though the dot-com crash and financial crisis, you would be closing in on $300,000 today. However, if you retired in 2000 with a portfolio invested in the S&P 500 and used a 4% withdrawal rate (increasing each year by 3% for inflation), your nest egg would less than $50,000 and on a path to zero!
 Now that you’re done reading articles about
 The Best Credit Card Bonus Offers – 2025
 Big List of Free Stocks from Brokerage Apps
 Best Interest Rates on Cash - 2025
 Free Credit Scores x 3 + Free Credit Monitoring
 Best No Fee 0% APR Balance Transfer Offers
 Little-Known Cellular Data Plans That Can Save Big Money
 How To Haggle Your Cable or Direct TV Bill
 Big List of Free Consumer Data Reports (Credit, Rent, Work)