Historical Federal Tax Rates by Income Group

In my last post on 2009 marginal tax rates, reader Alexandria (aka MonkeyMama) made a very good point that planning our retirements around future tax brackets is very difficult as they change all the time. But isn’t that what we are forced to do every time we contribute to a IRA and/or 401k? We can either pay tax now (Roth), or pay tax later (Traditional). In any case, I figured I should look into this more.

I previously explored this area in my post about historical marginal tax rates vs. median income. There, I concluded that at my current high income level, my personal tax rates would probably go up in the future. Now why might I change my mind?

Total Federal Tax Rate vs. Income Group
More recently, the NY Times published the following graph that plots the total federal tax rate vs. income starting from the 1960s. Total federal tax rate includes income taxes and also things like payroll taxes and capital-gains taxes.

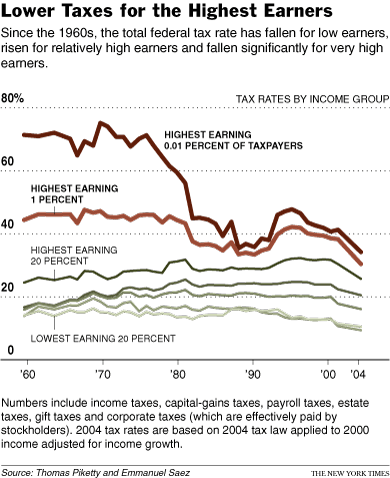
As you can see, tax rates as a whole have been dropping recently and are relatively low compared to the past. I would also note that the total tax rate at the median income group (middle 20% line) has varied very little over the last few decades, hovering around 18-20%.

Federal Income Taxes For Median Family
Next, here is a 2006 chart from the Center on Budget & Policy Priorities, which is based on Treasury Dept. data. The Center estimates that the median-income family of four will pay only 5.6 percent of its income in federal income taxes in 2006, the lowest since 1955.

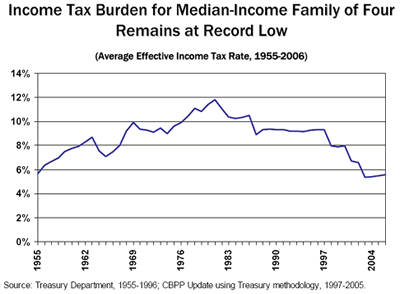
As you can see, the range for this median family has stayed between 6 and 12%.

My short take. Tax rates right now are historically low. Given this and all our future governmental obligations, they will most likely go higher. However, future tax hikes will probably be more heavily placed on high income earners as opposed to those earning at the median or below. The tax rate paid by the “middle class” tends to stay in a relatively low and narrow range.

Everyone’s situation is different. Right now, we are earning in the top 5% or so. But in retirement, I think we can easily fit into this median group, especially if the mortgage is paid off. So even though the future is unknown, my bet is that our tax burden will decrease upon retirement.

Undo/Redo Traditional to Roth IRA Conversion After Market Losses

If you did a Traditional IRA to Roth IRA conversion in 2008, and have since suffered some significant losses, you may want to consider undoing the conversion now that it is 2009. Then, as long as you wait 30 days after that and still qualify, you can redo the conversion again. This way, you only owe income taxes on the lower amount.

This Roth IRA conversion “do-over” is discussed in this CNN Money article, which included a helpful example scenario:

One of the main considerations are that you want to make sure your losses are enough that they likely won’t be recouped in the 30 days you are “out” of the market. One option is to re-invest the money in a taxable account during that period, but you’d be subject to more potential losses, as well as taxes on gains.

Another consideration is that you are essentially doing a entirely new 2009 conversion. You’ll have to again meet the income limits, and make sure your new tax bracket is acceptable to you. I did a Traditional to Roth IRA conversion in 2007 and shared my decision process, including the eligibility requirements and how to pay for it. There are more details on reconversions in this Fairmark article.

Next up: Controversial ways to deal with other Roth IRA losses.

January 2009 Financial Status / Net Worth Update

Net Worth Chart 2008

Credit Card Debt
I have no actual consumer debt. In the past, I have been taking money from credit cards at 0% APR and immediately placing it into high-yield savings accounts or similar safe investments that earn 5% interest or more, and keeping the difference as profit. I even put together a series of step-by-step posts on how I make money off of credit cards this way. However, given the current lack of no fee 0% APR credit card offers, I haven’t been as active with this recently.

Retirement and Brokerage accounts
The value of our passively-managed portfolio bounced back by about 10% compared to last month. There were no new contributions. As noted, we did manage to max out both of our 401(k)s this year, and plan on making 2008 IRA contributions by the April deadline.

Cash Savings and Emergency Funds
Our emergency fund balance is nearly at 12 months of our total monthly expenses. So theoretically both my wife and I could be laid off and we would be okay for 12 months without having to sell any longer-term investments. I am very happy with this cash cushion.

Where is it? I suppose you could say I “actively manage” my cash, putting it in various places to maximize yield while maintaining the highest possible safety. For example, I have some in a previous WT Direct promo at over 6% annualized interest, some in Series I Savings Bonds at over 6%, and a chunk at a WaMu 12-month CD paying 5% APY with about 10 months remaining.

Compare this to the piddly 0.14% for 90-day T-Bills and 0.43% on 1-year Treasuries! If you didn’t get in on any or all of these, keep reading or subscribe to updates for new deals as they come up.

Home Equity
I continue to estimate our home value using internet tools, starting with the average estimates provided by Zillow, Cyberhomes, Coldwell Banker, and Bank of America. This left me with $584,516. Then, I shave off 5% to be conservative and subtract 6% for expected real estate agent commissions (11% total) to reach my final estimate. Fortunately, we bought as prices were falling already, and the area where we live has not been hit nearly as bad as other major metropolitan areas.

Looking ahead, I am working on new goals for 2009, and also better metrics for measuring our financial progress. You can see our previous net worth updates here.

Worry-Free Investing: Calculate Your Risk-Free Savings Rate For Retirement

Conventional advice has been that we should invest in some mix of stocks and bonds to reach our retirement goals. But as we’ve seen, rolling the dice on a varying return distribution every year can be quite stressful. What if we start our retirement planning based on buying a safe investment that guarantees a steady after-inflation return instead? This question is posed in the book Worry-Free Investing by Bodie and Clowes.

Treasury Inflation-Protected Securities (TIPS) are bonds that promise you a total return that adjusts with the CPI index for inflation. Very generally, it works like this: if the stated real yield is 2% and inflation ends up at 4%, your return would be 6%. TIPS are issued and backed by full faith of the U.S. government, so they are as safe as they get. As your investment the automatically adjust with inflation, you will never have to deal with the stomach-churning swings of stocks, and also you avoid the risk of underperforming inflation that traditional (nominal) bonds have.

How much would you have to save if you decided to take zero market risk and invest solely in TIPS? The book outlines the mathematical formulas to use, but also provides a free spreadsheet calculator to do the heavy lifting for us. I uploaded it to ZohoSheets:

I would recommend playing with the numbers a bit. To start, the book was written in 2003 when the real rates were relatively high at around 3%. Given the recent history of the 20-year TIPS yield (shown below), I would assume a maximum of a 2.5% real interest rate.

I would also change the replacement rate to something that more closely tracks your specific expected expenses. The book recommends the income required to maintain your “minimum acceptable living standard”. For the skeptical and/or early retirees, don’t put in anything for Social Security. Finally, don’t forget to input your current savings.

You now have your personal risk-free savings rate to reach your goals. (Warning: It might be really high! If so, try retiring at 65 and input something for Social Security.) But let’s say you need to save 10%, but you are able to save 15%. You could put the 10% in the ultra-safe TIPS, and put the other 5% in something riskier to boost your returns while still guaranteeing a minimum future income. I’ll share a possible solution from the book once I get access to a flatbed scanner.

Now, there are lots of potential glitches with this simulation. For one, there is reinvestment risk because the TIPS real interest rate will continue to vary, and could drop to much lower levels. The government could even conceivably stop selling new TIPS at any time. Some people are skeptical that the CPI properly tracks inflation. Finally, TIPS are taxed at ordinary income levels, so one should keep them in tax-advantaged accounts. However, most people’s 401ks don’t include TIPS as an option! Otherwise, taxes are going to hurt returns.

In the end, I think a portfolio of 100% TIPS is impractical for most people. However, I definitely like TIPS as a component, and see this thought process as a way to estimate a “target” savings rate that can let those so-inclined to take less risk and sleep better at night.

Saving More May Allow You To Take Less Stock Market Risk

Vanguard has a new article titled The importance of saving more, which tries to address evidence that investors may believe that “choosing investments that offer the possibility for relatively higher returns—and accepting the accompanying greater degree of risk—is a more viable alternative than saving more.”

In addition, the last few months probably have many of us re-examining the amount of risk we are comfortable with in our portfolios. I know I have. So what can we do?

Taken from the article, the figure below shows hypothetical outcomes for different portfolios based upon the following scenario: A 35 year-old individual begins saving 4% (grey bars) of his gross annual salary ($50,000, adjusted annually for inflation) each year for 30 years. In the red bars, the same individuals instead saves 6% of his salary. I highlighted two of the more interesting situations with the green arrows:

Here you see that based on historical data, the combination of a 50% stock/50% bond allocation and a 6% contribution rate leads to a similar range of outcomes as a 100% stock allocation and a 4% contribution rate. In fact, the former has a slightly better median outcome with much smaller swings over the years.

For example, a 50/50 asset allocation this year would have been down only around about 20%, instead of the stomach-churning 40% drop of a 100% stock portfolio. Wouldn’t that have been nice?

Higher savings provides a higher probability of success by shifting some of the responsibility for accumulation from the less-certain return stream of risky assets to a more-certain savings stream. In the end, if an investor is trying to maximize future wealth, a marginally higher savings rate rather than a substantially higher risk portfolio is the most likely path to retirement success.

As opposed to many rules of thumb, not everyone at the same age has to have the same asset allocation. Savers may get to take less risk and sleep better at night. 🙂 Something to think about…

December 2008 Investment Portfolio Update

I’ve been trying to re-balance my portfolio using my recent 401k contributions, but I ran into some speed bumps, so here is a brief interim update.

9/08 Portfolio Breakdown
 
Retirement Portfolio Actual Target
Asset Class / Fund % %
Broad US Stock Market 27.7% 34%
VTSMX – Vanguard Total Stock Market Index Fund
DISFX – Diversified Stock Index Institutional Fund*
FSEMX – Fidelity Spartan Extended Market Index Fund*
US Small-Cap Value 9% 8.9%
VISVX – Vanguard Small Cap Value Index Fund
Real Estate (REITs) 8.5% 8.5%
VGSIX – Vanguard REIT Index Fund
Broad International Developed 25.8% 25.5%
FSIIX – Fidelity Spartan International Index Fund*
International Emerging Markets 7.1% 8.5%
VEIEX – Vanguard Emerging Markets Stock Index Fund
Bonds – Short-Term 4.6% 3.8%
VFISX – Vanguard Short-Term Treasury Fund
Bonds – Inflation-Indexed 12.7% 11.3%
VIPSX – Vanguard Inflation-Protected Securities Fund
Cash 4.7% 0%
FDRXX – Fidelity Cash Reserves
Total Portfolio Value $95,678
 

* denotes 401(k) holding given limited investment options

Contribution Details
For 2008, we have finally both contributed the annual maximum of $15,500 each towards our respective 401ks. We have not made any 2008 IRA contributions, but we did make 2007 contributions in April 2008. We will likely do our 2008 contributions in April 2009 deadline.

YTD Performance
The 2008 year-to-date time-weighted performance of our personal portfolio is now -42.5% as of 12/8/08.

For reference, the Vanguard S&P 500 Fund has returned -36.69% YTD, their FTSE All World Ex-US fund has returned –47.98% YTD, and their Total Bond Index fund is +2.20% YTD as of 12/8/08. The Vanguard Target 2045 Fund has returned -35.79 YTD, primarily due to a small international allocation.

Investment Changes
In my wife’s 401k plan, a few new investment options were added, including the Fidelity Extended Market fund (FSEMX). This is a nice complement to their in-house S&P 500 index fund. If you take 75% S&P 500 and 25% Wilshire 4500 Completion Index, you pretty much get the Total US Market, so we have moved our investments to that and sold off the bit that we had in the actively-managed Dodge & Cox fund. Nothing else in that 401k is terribly appetizing.

We have used our new contributions to bring us back towards our asset allocation target, with a 85% stocks/15% bonds split. This means I have been buying more International, REIT, and Small Cap. I have also been swapping funds around to make things “fit” better, due to the limitations of spreading money across different accounts.

You’ll notice that I am really below-target in my US allocation, and have $4,500 in cash. This is because the fund minimum for the Fidelity Spartan Total US index fund is $10,000 (in my 401k). In early 2009, I hope to add enough money to reach the minimum. I could buy ETFs instead or another more expensive Fidelity fund as a tracker, but not sure if I want to pay the roundtrip commissions given that it will be less than a month. Currently on the fence.

You can view all my previous portfolio snapshots here.

December 2008 Financial Status / Net Worth Update

Net Worth Chart 2008

Credit Card Debt
I have no actual consumer debt. In the past, I have been taking money from credit cards at 0% APR and immediately placing it into high-yield savings accounts or similar safe investments that earn 3-5% interest or more, and keeping the difference as profit. I even put together a series of step-by-step posts on how I make money off of credit cards this way. However, given the current lack of good low fee 0% APR credit card offers, I don’t think I’ll be doing anymore in the near future.

Retirement and Brokerage accounts
Ignoring new contributions, my retirement accounts have lost about ~$8,500 over the last month. I will perform another portfolio update soon to find more accurate year-to-date return numbers.

I have sent in another $5,000 late last month and $5,000 this month in order to max out my pre-tax 401k contributions for this year. My asset allocation is way off target so I need to sit down and try to rebalance using these funds today. It might be tricky to due to the $10,000 minimums for index funds at Fidelity, and I might actually buy ETFs and pay the trade commission.

Cash Savings and Emergency Funds
Why am I not panicking (yet)? Well, I think a big part is my fat cash pile that serves as my emergency fund. In my mind, having a separate short-term reserve keeps me from worrying about my long-term “can’t touch” portfolio.

I have about $49,000 net in sitting in different forms of safe cash earning from 3 to 6% interest, while now my entire retirement portfolio is worth about $93,000. I will keep accumulating cash until I reach a full year’s worth of expenses, which is about $60,000. I think this is prudent given the high unemployment rate right now.

Home Equity
This is the second month of testing out my new way of estimating our house’s value. Again, I take the average estimates provided by Zillow, Cyberhomes, Coldwell Banker, and Bank of America. Then, I shave off 5% to be conservative and subtract 6% for expected real estate agent commissions (11% total). I use this final number as my estimate for home value. Looks like my home value has dropped by another 1% or so.

Overall, another tough month. However, I am very thankful we both still have jobs – knock on virtual wood!

You can see our previous net worth updates here.

Vanguard’s New Self-Employed 401(k) Plan – Roth Option Included

Vanguard has recently announced the details of their Individual 401(k) plan – otherwise known as Solo 401k or Self-Employed 401k. Although you can’t apply yet it seems, many of us passive investors have been waiting for Vanguard to offer this for a long time.

The Vanguard® Individual 401(k) plan is a retirement plan for self-employed individuals. This plan is available only to sole proprietors or partners in business who have no common-law employees. The only other participant allowed in this plan would be a spouse of the business owner if he or she works for the business. Business owners should not establish this plan if they have common-law employees, including their children.

There is some confusion as to whether this includes the sole owners of an S-Corporation, but I’m betting it does as it is a passthrough entity and we are essentially self-employed. Here are some more Vanguard-specific details, along with some comparison with the Fidelity Self-Employed 401(k) which I currently have:

  • Seems like you can buy any Vanguard fund with no commissions, and there is “no minimum initial investment required to open most funds” (emphasis mine). It doesn’t seem like you have the option to buy ETFs through their brokerage service. At Fidelity, the Fidelity funds are also free, but I am subject to minimum initial investments. However, I do have the ability to buy any ETF with a $12-$20 commission, as well as buy individual bonds.
  • The Vanguard Individual 401(k) will accept three types of employer and employee contribution sources: individual employee salary deferral contributions (pre-tax money), traditional employer contributions (pre-tax money), and Roth salary deferral contributions (post-tax money). Roth is available! Fidelity does not have this.
  • Employees can move money between different Vanguard funds by phone or in writing only. This is kind of a pain. I can manage my Fidelity Self-Employed 401(k) online like a regular brokerage account, with limit trades and everything.
  • There are no set-up fees charged to the employer for a Vanguard Individual 401(k) plan. Vanguard charges employees a $20 annual account service fee for each mutual fund held in an account within the Vanguard Individual 401(k). If you like to own multipole funds, that can add up quickly! (Note: If at least one participant in a Vanguard Individual 401(k) plan qualifies for Flagship™, Voyager Select™, or Voyager™ Services, the account service fee will be waived for all participants in the plan.) Fidelity has no setup fees, and no annual account fees at all.
  • Rollovers are permitted out of the Vanguard Individual 401(k), but not into it. Not sure why this is the case.

This is only a superficial review, but so far I’m not planning to try and open one. It turns out that I am quite happy with my Fidelity Solo 401k, as it provides a lot of flexibility, great customer service, and reasonable costs. Vanguard has a wider array of index funds, but I can also buy the equivalent Vanguard ETFs at Fidelity. If I buy in large enough chunks, the commission is balanced out by the lower annual expense ratios. Besides, if you are at not at least Voyager ($50k in assets), the $20 fee per fund from Vanguard costs as much as two trades anyway.

The main thing going for Vanguard is the Roth option, which I must admit should be very attractive for most people. But for us, our current tax bracket is high enough that I prefer pre-tax contributions.

Via Guzzo the Contrarian and Bogleheads.

Shorter Full-Retirement vs. Longer Semi-Retirement?

Which would you rather do:

A) Work 40 hours/week for 15 years, and then not work at all for the next 15 years, or

B) Work 20 hours/week for 30 years?

If you were to ask me a few years ago, I would have picked A. Now, I’d much rather have B. Of course, it’s not as simple as just picking one or the other. Some sample considerations:

  • At most jobs, you can’t simply decide to work less hours and get pro-rated pay. A job change or some clever negotiations with management might be necessary. Self-employment may be better suited to option B.
  • Even if you can work half-time, often you lose your healthcare benefits. This might be reasonable if you are single, but for a family with kids the costs can be pretty high. Might need to investigate alternative ways to get group coverage (professional association, creating your own small business insurance group).
  • For option B, you have less money coming early on, but you have more time for compound interest to occur before taking withdrawals. The opposite is true for option A – more money upfront, but you’ll need to start spending sooner.
  • The (historically) optimal investing asset allocation might be different for both situations.
  • With option B, depending on timing and desire, you would have more ability to spend time with your children when they are young. Is time upfront worth more than time later? Quite possibly.
  • I think it would be hard for me not to work at all. For one, there is the stress of trying to live off a finite amount of money. Second, one would need to find another purpose in life to fill all the hours. Others might find it really easy…
  • Option A gives you a bit of leeway if investment returns don’t pan out as you’d like. Maybe you’ll work a bit longer than 15 years. Trying to make up lost savings when you are older may be more difficult (ageism) and/or tiresome (just age).
  • Lower annual income with option B might leave you with lower overall tax hit.
  • Behaviorally and psychologically, it may be easier to spend less if you force yourself to make less.

I need a better name than “semi-retirement”. Downshifting? Half-retirement? Half-working? Working 9-1?

Got Enough To Retire? Frugal Spenders Just Might

In a CNN Money article titled “Got enough to retire? Think again”, I actually found the opposite.

The main point of the article is that you may need to replace a lot more than just 70-80% of your pre-retirement income after you stop working.
Here’s the chart of average replacement rates from an Aon study:

However, I am agreeing with the authors of Spend Til The End on this one – using replacement rates and averages for this sort of thing is dangerous. One should always look at their own unique situation. It’s you, isn’t it? For example, I don’t see why a household earning $100k or even $500k a year can’t get by on spending $40k per year, especially if their mortgage is paid off.

But after looking at the chart some more, something else caught my eye.

Let’s just say that your spending in retirement requires income of $40,000 per year. This is the same as assumed for a household earning $50,000 pre-retirement according to the study. Even though we earn more than that, I know that we can easily run on $40k per year outside of housing costs.

The graphic suggest that 50% of that, or $25,000 per year, will be covered by Social Security. That only leaves $15,000 per year to be covered by your pension or investment portfolio. Assuming no pension and a 4% withdrawal rate, that means you would need a nest egg of $375,000 in today’s dollars. That is much less than the multi-million dollar figures usually being thrown around.

Now, how much would you need to save to get that $375k? If you save $5,000 inflation-adjusted dollars per year, and they earn a 4% annual real (above inflation) return, every year for 35 years – you’d end up with a little over $380,000. In essence, you’d just have to max out your Roth IRA each year and call it a day. (The contribution limit is $5,000 this year, but the cap rises with inflation.)

Of course, this is all rough numbers and you’ll still have to work until the full Social Security retirement age. Most young people like myself are skeptical of Social Security, but I have come to believe that SS will be with us for a long time – it is just too critical a piece of the retirement puzzle for much of America. And hey, the solution to any underfunding – as always – is simple: tax the high-income earners more!

Exploring Consumption Smoothing: An Alternative Path To Retirement Planning

I just finished reading the book Spend ‘Til the End: The Revolutionary Guide to Raising Your Living Standard–Today and When You Retire by Burns and Kotlikoff. One of the main themes of the book is consumption smoothing, which is an economic theory where the primary goal of financial planning is to avoid abrupt changes in one’s standard of living.

This can actually be a very controversial goal, because it may ask you to borrow money or even stop saving at times, in order to maintain a constant standard of living. Here is an illustration of this idea taken from the website for ESPlanner, which is a financial planning software package made by Kotlikoff.

Note that consumption smoothing can be very different from what other traditional methods propose. For example, one traditional goal is to replace 75-100% of your current income in retirement. Another generic rule of thumb (which they call “rules of dumb”) might be to simply save 10-15% of your annual income. The authors argue that these one-size-fits-all approaches can greatly overestimate or underestimate the amount of saving one’s family needs to do, leading to the dreaded “standard of living disruption”:

As far as they are concerned, both scenarios are equally bad. Undersavers might die broke. Oversavers are misers and compared to the mentally insane.

Replacement Rates Are Stupid, But Is Smoothing Better?
Now, I would agree that those 5-minute retirement calculators like Fidelity’s MyPlan Calculator or T. Rowe Price’s Retirement Income Calculator can be really off.

For example, Fidelity’s calculator assumes I will need 85% of my pre-retirement income in retirement. But what if my kids are grown up and we’ve already paid for college tuition? What if our house is paid off? What if it isn’t? All these things change what income we need. Look at us – I’ve already calculated that our total non-housing expenses are around $30,000 year – this is less than 15% of our current combined income. An 85% replacement rate would inflate our nest egg target by millions of dollars!!

So yes, inflexible replacement rates are stupid, but I don’t know if consumption smoothing is that much better. I would use ESPlanner, but it costs $200. It is plugged so much in the book that I feel like book buyers should have gotten a free 30-day trial at least to play with it. But I’m betting that even with the smoothing approach, the software will simply say something like “you can maintain a maximum spending standard of $80,000 every year.” Still much more than I need to spend to be content.

I would rather have each household try to estimate their own spending needs from the ground up, and not just spend what some software program tells you to spend. What makes you happy? What are your priorities? What is enough? Then, find a way to create that income.

Predicting The Future
Here’s the problem with all these future calculators. Any time you extrapolate 30 years into the future, any slight change in inputs can throw things way off. Let’s say you think your investments will average 8% returns annually. What happens if it’s only 6%? You estimate inflation at 3%. What if it’s 4%? What if you are 60% stocks/40% bonds, nearing retirement, and your stocks drop 40% in less than a year (*ahem*)? Finally – what about jobs? People switch jobs, careers, geographic locations. Income isn’t so predictable either.

With all this uncertainty, having a calculator tell me I can spend $68,644.55 this year and every year after that just doesn’t seem right.

I don’t know about you, but I see running out of money as a lot worse than ending up with too much. Accordingly, I simply view retirement (financial independence, whatever) as a goal to be reached as soon as possible, while still enjoying life along the way.

Positive Consumption Slope?
Just a thought, but I don’t know if I would want a constant standard of living anyway. I would rather having a slowly improving standard of living, so that life is (supposedly) getting a little better as I go.

Still, consumption smoothing is an neat concept, and the book goes on to extend it into a number of other interesting examples. More to come…

Portfolio Changes: Buying More TIPS Inflation-Protected Bonds

This past week, I made some minor tweaks to my investments. No, I didn’t go all cash! Previously, I had set the bond portion of my portfolio to be 50% short-term Treasury bonds and 50% Treasury inflation-protected bonds (TIPS). I use the mutual funds VFISX and VIPSX. However, this week I shifted my allocation to be 25% short-term Treasury bonds and 75% Treasury inflation-protected bonds (TIPS).

Comparing Yields to Find Expected Inflation
You can compare the nominal yield of the Treasury bonds and the real yield of TIPS and find the implicit expected inflation. For example, if a 20-year Treasury bond yields 5%, and TIPS yield 2% real, then the expected inflation is the difference, or 3%. (If inflation is 3%, then the nominal yield of TIPS becomes 2% + 3% = 5%.)

This week, the expected inflation over the next 10 years has been hovering around 1%, some of the lowest in a long time. On Monday, the 10-year Treasury yield was 4.08% and the TIPS real yield was 3.05% (source: US Treasury), for an expected inflation of 1.03%. As of Friday, the gap was 1.02%. For the 20-year bonds, the gap predicted inflation of a about 1.6-1.8%. If the actual inflation rate turns out to be greater than these values, then holding TIPS will result in a higher yield over time.

Here is a chart of annual CPI-U changes over time (source: BLS.gov). The red line is the 10-year moving average:

Yes, there are deflation worries in the near future, but you can see the only decade that inflation has averaged below 1% was during the Great Depression. Not only that, but our currency was still on the gold standard then.

Currently High Real Yields
As mentioned earlier, the current real yields offered by TIPS of around 3% are also the highest in many years:

Since real yields are rising, the value of existing TIPS have actually dropped. So I’m buying low. 🙂 If real yields rise any higher, I’d buy even more.

Making The Change
There are many things to consider out out there, like global demand and the infamous $700 Billion bailout package (where do you think this money comes from?), but I only see more spending and borrowing down the road. With the printing presses available to go full blast, and lots of future promises made, I just can’t see inflation being this low for a decade.

Combine this with the fact that TIPS have a historically high real yield, it would seem like the market is overreacting. Although I usually don’t make such changes, I decided to go for it. So far, I have chosen not to go with 100% TIPS because I wanted to maintain some of the benefits of short-term treasuries, like lower volatility and low correlations with other assets. It’s kind of tough though, as the yields are horribly low right now due to the flight-to-quality.

I haven’t increased the target amount of total bonds in my portfolio, although due to the current drift and limitations due to juggling separate accounts, they are now 18% instead of 15%. I still believe in stocks as well due to their low valuations, and have also made equities purchases this week to re-balance that side of my portfolio. I am expecting to invest another $10,000+ before the year ends.