Create Your Own Pension With Immediate Annuities

People love pensions because of the security that they offer – a steady, guaranteed stream of income that you can’t outlive. Another way to achieve this reliability is to buy an immediate annuity, also called an income annuity. It lets you convert a lump-sum payment into a regular stream of income payments that can last for your lifetime, or the longer of you or your spouse’s lifetime.

Although there are many factors that come into play, very generally immediate annuities pay about 6-7% of the lump-sum back to you every year. So if you bought a $500,000 lifetime annuity, you might get $35,000 every year until you die. You can also play with the quotes at ImmediateAnnuities.com for different ages and survivorship scenarios.

This is much higher than the “safe withdrawal rate” of 4% that many financial folks quote as the amount of your nest egg that you can spend each each without running out of money before expiring. 4% of $500,000 is only $20,000 per year. More info on safe withdrawal rates can be found here.

But remember, with an annuity the $500,000 is gone. If you live another 50 years or just one, after you die there is nothing left to inherit. Also, annuity providers are like life insurance companies in that you really need to make sure they are stable enough that they’ll be around to pay you! Look for ratings from A.M. Best Company, Moody?s, and Standard & Poor?s.

The last article I mentioned when talking about how pensions will be gone soon also suggested annuities as a possible reform to current retirement plans:

If defined benefits are on their last legs, then it would make sense to try to incorporate their best features into 401(k)’s. The drawback to 401(k)’s, remember, is that people are imperfect savers. They don’t save enough, they don’t invest wisely what they do save and they don’t know what to do with their money once they are free to withdraw it. Quite often, they spend it.

Here there is much the government could do. For instance, it could require that a portion of 401(k) accounts be set aside in a lifelong annuity, with all the security of a pension. Behavioral economists like Richard Thaler have demonstrated that you can change people’s behavior even without mandatory rules. For instance, by making a high contribution rate the “default option” for employees, they would tend to deduct (and save) more from their paychecks. If you make an annuity a prominent choice, more people will convert their accounts into annuities.

If you think of pensions as annuities, you can use this to get a feel for how much those pensions are worth! For example, let’s say you’re a teacher and about to retire with a pension paying 70% of the average of your highest 3 years of income. If that number is $50,000, then you’ll be receiving $35,000 every year. If you refer back a few paragraphs, you’ll remember that’s the same as having saved up half a million dollars! Now you see how pensions are so expensive.

Although I’m still far from retiring, I have started considering using part of my savings to by an immediate annuity in order to cover my most basic spending needs and reduce the risk of retiring early in the event of a turbulent stock market. It would be almost like buying my own Social Security safety net 🙂 But I’ll also need to learn more about how this plan should affect my current asset allocation. Some papers that are on my (really, really, long) reading list can be found here.

(There are also probably some tax considerations that I’m ignoring here.)

Why Pensions Are Soon To Be History

It’s been a few years since the United Airlines debacle where they unloaded their pensions onto the government-created Pension Benefit Guaranty Corp, but the future of pensions are still a huge issue for many people. If you’re interested in more background, try perusing this New York Times article called The End of Pensions. It’s long, but I found it fascinating.

First, some background:

It happened that 401(k)’s, which were authorized by a change in the tax code in 1978 and which began to blossom in the early 1980’s, coincided with a great upswing in the stock market. It is possible that they helped to cause the upswing. In any case, Americans’ experience with 401(k)’s in the first two decades of their existence was sufficiently rosy that few people shed tears over the slow demise of pension plans or were even aware of how significantly pensions and 401(k)’s differed. But 401(k)’s were intended to be a supplement to pensions, not a substitute.

I find it very ironic that companies are failing to provide for their employee’s retirements, just like individuals are now accused of failing to provide for their own retirements. Simply put, these corporations used rosy predictions to justify not saving enough money!

Given that pension promises do not come due for years, it is hardly surprising that corporate executives and state legislators have found it easier to pay off unions with benefits tomorrow rather than with wages today. Since the benefits were insured, union leaders did not much care if the obligations proved excessive. During the previous decade especially, when it seemed that every pension promise could be fulfilled by a rising stock market, employers either recklessly overpromised or recklessly underprovided – or both – for the commitments they made.

Gee, that sounds kind of familiar. You could partially blame the government for their lax accounting and lack of good funding requirements. Still, if the government provided the bullet the companies pulled the trigger:

For example, United Airlines did not make contributions to any of its four employee plans between 2000 and 2002, when it was heading into Chapter 11, and made minimal contributions in 2003. Even more surprisingly, in 2002, after two of its jets had been turned into weapons in the Sept. 11 disaster, and when the airline industry was pleading for emergency relief from Congress, United granted a 40 percent increase in pension benefits for its 23,000 ground employees.

So what does the future hold?

In 1980, about 40 percent of the jobs in the private sector offered pensions; now only 20 percent do. The trend is probably irreversible, because it feeds on itself. Hewlett Packard, for instance, must compete with younger companies like Dell Computer that do not offer traditional pensions.

And what about state and city governments? Chances are that they’re underfunded too.

Because public pension benefits are legally inviolable, default is not an option. Sooner or later, taxpayers will be required to put up the money (or governments will be forced to borrow the money and tax a later generation to pay the interest).

Thus, unions can bargain for virtually any level of benefits without regard to the state’s ability, or its willingness, to fund them… At least in the private sphere, there are rules – ineffectual rules maybe, but rules – that require companies to fund. In the public sector, legislatures wary of raising taxes to pay for the benefits that they legislate can simply pass the buck to the future.

Yet another form of focusing on short-term gain and not looking at the big picture. Sigh.

Are We Saving Too Much For Retirement?

piggy bankOne contrarian article deserves another. This one, courtesy of the New York Times is titled “Save Less and Still Retire With Enough”. The main premise is that contrary to popular opinion, most of us are actually doing just fine money-wise. All this talk of impending consumerism-drive doom? It’s a big scam by the investment companies, who have a vested interested in us keeping big balances in our brokerage accounts.

The more realistic amount could be as little as half the typical recommendation made by Fidelity, Vanguard or any number of other financial institutions. For a middle-income couple, that could mean trading $400,000 in retirement money for about $3,000 a year more during prime working years to spend on education or home improvement. ?For a middle-class household, that?s a lot of money,? said Laurence J. Kotlikoff, a Boston University economics professor, who is on the forefront of this research into spending and savings, and is selling his own retirement calculator.

You can read more of Mr. Kotlikoff’s research here. Here is an excerpt from one paper:

TIAA-CREF is recommending a retirement ?salary replacement? target equal to 80 percent of annual labor earnings. For our stylized household [couple earning $125,000 with two kids], this equals $100,000… This is 78.0 percent higher than the appropriate target!

In other words, his “appropriate” target replacement salary is actually only about 45% of their previous income, or $56,000, for a couple earning $125,000 a year. This is due to a number of factors which aren’t explained in detail, but factor in that their house should be paid off and the kids will be gone during retirement. However, I saw no mention of the increased costs from health insurance and other medical costs that increase with age. He also expects the their investments to earn 9% a year (6% real, 3% inflation), which is a bit optimistic to me.

In the end, of course some people are saving too much. I mean, if you’re eating Cup o’ Ramen ten times a week and checking your million-dollar bank balance on the free computers at the public library, sure, maybe you need to loosen up a bit. I’ve never met any of these people, have you? There’s no way that they outnumber the ones that are saving too little.

And how do we even know what will be too much or too little? Every retirement calculator is simply trying to predict the future. Note the huge “we are not liable if this is wrong” disclaimers. I’ve read a lot of articles that also support the fact that the stock market will only earn about 6% annually in the future, and similar ones that say that the long-term expected returns of stocks will be the same as bonds. Japan’s stock market has been in the dumps for more than decade.

A possible personal solution?
I’m trying to come up with what I call the Core Lifestyle, which essentially includes everything that I would personally really want out of life – things like a job that I value, a small house in a specific area, a skiing season pass, and an international trip every year. The idea that this should require a certain amount of money, for example $100,000 a year. (Yes, I am aware that this is a lot of money. I’m also living in a big West Coast city…) My feeling is that after a certain point, any extra spending just ends up on “stuff” like nice cars, gadgets, brand name clothes, and bigger houses that really won’t improve my quality of life.

Anything above that threshold goes into investments. This is opposite of some plans which suggest socking away a specific percentage of your gross income each year. Then, as our wealth builds, whenever it is that we have enough to cut back on working, we will! It could be 39, 45, or 52. There would be no “squandering of youth”. We’ll live well now, and then we’ll live even better after that. Sounds easy, doesn’t it? We’ll see how it goes 😛

Do you feel like you’re depriving yourself now to save for retirement? If your retirement planner told you that you could save less, would you do it?

My 401k to IRA Rollover Decision Process

A couple of people have asked me about rolling over their 401(k) plans into an IRA. I actually went through the decision process myself back in the middle of 2005, but that was 500 posts ago so nobody can find it anymore! Here they are:

Part 1 – Stay put with old 401k?
Part 2 – Maybe Rollover into Fidelity?
Part 3 – Vanguard Options
Part 4 – Final Decision

The main differences between then and now is that (1) there are more low-cost ETF options available now that cover just about every asset class, and (2) more brokers that offer cheap or free trades. If you are rolling over a lump sum and don’t plan to trade very much, ETFs may present a lower-cost alternative. Still, if I had to make the decision again today I think I would end up at the same conclusion. My expense ratios are already low, and I make enough trades that the net cost difference is minimal. I continue to be very happy with the competent and helpful support from Vanguard. My portfolio has since changed from their Target Retirement funds to something slightly more complicated.

I should add that I also opened a Self-Employed 401k with Fidelity last year, and have also been very satisfied with their customer service. I still wish they would expand their Spartan index fund lineup, though, and if Vanguard offered a low-cost Self-Employed 401k option I would have went with them.

Risk and Return Relationships For Different Asset Allocations

After looking at how other people and mutual fund companies choose their asset allocation, I’m a little conflicted. Both the Vanguard and T. Rowe Price mutual funds recommend holding nearly 80% in stocks at age 50. That’s pretty aggressive in my book. To see why, let’s look at some historical numbers.

Coincidentally, a commenter left me a link to a recent FundAdvice article about fine-tuning your asset allocation. I’m actually going to ignore the specific components of his portfolio and focus on the general trends instead. Let’s just say it’s well-diversified.

The article provides historical numbers (1970-2006) that compares risk versus return for portfolios ranging from 0% stocks to 100% stocks. Risk is represented by standard deviation, a measure of volatility.

Risk vs. Return For Varying Stock Percentages
Risk vs. Return

This is pretty consistent with a lot of other similar charts I’ve seen. You’ll notice that the slope of the curve decreases as you move towards holding more stocks. Accordingly, if you compare the differences between successive dots, there risk gap grows larger and the return jump decreases. In other words, you are generally getting less return for each unit of risk as you keep adding more stocks.

Here is another risk-reward chart for increasingly aggressive portfolios.

Still, this chart really doesn’t help too much either. Why not just go for the 100%? Instead of averages, let’s focus on how bad it can get over the same time period (returns not annualized):

Worst Returns For Various Portfolios

This second chart is more important than the first one, because you won’t get any of the returns listed above unless you can “stay the course” through periods such as these.

It’s really easy to say “Oh, 30% drop, no problem”, but that’s not the whole picture. Not only will stocks be dropping, but bonds may be skyrocketing. Imagine if bonds are returning 15% a year at the same time stocks are going down 15%. You will have what appears to be a way out! Personal finance magazines will be shouting “Bonds are back!” Cutting down on your stock exposure will become the “prudent” decision.

Going back to the 80% stocks at 50 years old… Can you imagine losing 35% of your portfolio in one year at 50 years old? I would freak out. This is why age matters, it’s so much easier to shrug off losses when you know you won’t need the money for another 30+ years.

What Percentage Of Your Portfolio Should Be In Stocks?

One of the basic ways to adjust the risk and return characteristics of your investment portfolio is to decide what percentage to hold in stocks and bonds. This is another one of those hard questions for which there is no single best answer for everyone. You must take into account risk acceptance and time horizon amongst other factors.

An old rule of thumb is that your stock allocation percentage should be 100 minus your age. That is, a 30-year old should have 70% stocks/30% bonds, and a 70-year old should have 30% stocks/70% bonds. This was not just taken out of thin air, and has a basis from historical returns. As you near retirement, you want to have more bonds as that reduces overall volatility. More recently, others have altered this to a more aggressive “110-age” or even “120-age”.

Members of the Diehards investment forum recently performed a informal survey of member’s asset allocations versus their age, and here are the results:

Credit: Diehards Form

As you can see, there is definitely a lot of scatter in the data. However, if you made a linear fit, it roughly corresponds to a formula of stock percentage = 112.5 – age.

This made me curious – what about all those Target Retirement Funds? Their job is to decide an asset allocation that works for as many people as possible based on their retirement date. If I assume that people retire at 65 years old, here is what the asset allocation versus age looks like for three of the more popular fund families: Vanguard, Fidelity, and T. Rowe Price:

Target Retirement Fund Asset Allocation vs. Age

As you can see, the funds are actually pretty aggressive. (I covered previously how T. Rowe Price is more aggressive than Vanguard.) If one did force linear fits for all three fund families, it would correspond roughly to stock percentage of 119 – age. However, they don’t really adjust linearly with time. If I use a 2nd order curve fit instead, I can make a little tool that estimates their stock percentages for any age:

Input Your Age: Years
Percentage in Stocks
Vanguard Model:   %
Fidelity Model:   %
T. Rowe Price Model:   %
120 – Age:   %
113 – Age:   %

None of this is investment advice, it’s just an observation of what’s out there. Next, I’ll try to find some historical return and standard deviation numbers for another view of how to answer this question. What do you think of all this?

Do You Have a 403(b) Plan? Don’t Miss 403bWise.com

I’ve always thought of 403(b)s as identical to 401(k)s, just for non-profit and educational institutions. But upon discussing this with a teacher, I found out that they can have their own unique problems: primarily high-priced annuities. Did you know that 80% of 403(b) funds are currently invested in fixed or variable annuities? This is really surprising, considering that annuities are usually only a good idea for high-income people who’ve already maxed out all their other tax-deferred options – why put a tax-deferred product inside another tax-deferred product?

If you’re not sure what you have in your 403(b) accounts, I would definitely recommend reading up at 403bWise.com. Started by teachers, it has a wealth of information about your investment options. Did you know that if you summed up all the various annuity costs you could be losing 3% to fees every year? If you are stuck with a bad administrator, you may be able to do what is called a “90-24 transfer” to a low-cost provider like Fidelity, Vanguard, T. Rowe Price, or TIAA-CREF. There are some upcoming law changes and this transfer ability expires at the end of 2007, so compare your options soon. Another route is follow other teachers and fight for a change from within.

There is also 457bWise for 457(b) holders.

Tax Efficient Mutual Fund Placement For Maximum Return

After choosing your asset allocation, it is still important to think carefully about where to place each type of investment. After all, what you actually keep is your return after taxes. For example, a stock index fund that tracks the S&P 500 will have low turnover and primarily pay qualified dividends which are taxed at the lower long-term capital gains rate (max 15%). On the other hand, REITs and bonds tend to distribute a significant amount of their return annually as unqualified dividends, which are then taxed as ordinary income (max 33%). Therefore, you should try to take advantage of your tax-sheltered accounts as much as possible by placing the least tax-efficient assets there.

Below is a chart that shows the major asset classes sorted by tax efficiency. It is based on information from the fine books Bogleheads’ Guide To Investing and The Four Pillars of Investing.

Chart of Relative Tax Efficiency of Assets

Let me clarify the chart above. You should start with the least tax-efficient assets and place them in your pre-tax accounts (Regular 401ks, 403bs, Traditional IRAs) first. Then the next least efficient assets should into the post-tax accounts (Roth IRA, Roth 401k). Only what is left after this should end up in taxable accounts.

In general, bonds should go into tax-deferred accounts, leaving stocks for your taxable accounts. There are even special “tax-managed” mutual funds which work hard to minimize any capital gains distributions and are designed specifically to be placed in taxable accounts.

This article is part of my Rough Guide To Investing.

Fidelity MyPlan: Should Good Savers Invest Less Aggressively?

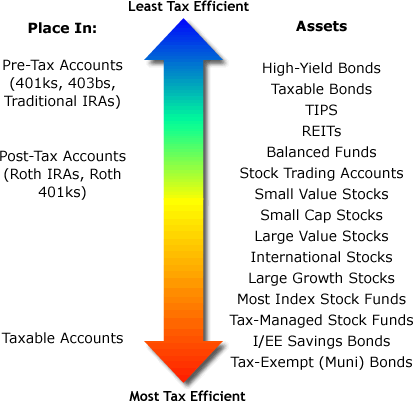
Fidelity has a new tool called the myPlan retirement calculator. It’s very soothing and is only 5 questions long, why not give it a whirl? What I like about it is that it doesn’t just deal with average numbers. People like to use round numbers like 8% annually and pretend like they are a sure thing, but the fact is with some bad timing we could end up doing a lot worse.

Using some rough numbers from our own situation – age 28, $100k income, $100k saved so far, $2,500 saved monthly, Aggressive Growth investment style, we get the following result:

myPlan Screenshot

Not bad, right? If the market performs on average, we will easily exceed what we need to retire on. (Yes, the numbers are huge!) If the market performs poorly however, we’ll be significantly short. Now, what if we change the investment style from Aggressive to Conservative?
[Read more…]

February 2007 Investment Portfolio Snapshot

It’s time for another bi-monthly update on my investment portfolio.

2/07 Portfolio Breakdown
 
Retirement Portfolio
Fund $ %
FSTMX – Fidelity Total Stock Market Index Fund $11,212 15%
VIVAX – Vanguard [Large-Cap] Value Index $14,057 19%
VISVX – V. Small-Cap Value Index $14,184 19%
VGSIX – V. REIT Index $9,781 13%
VTRIX – V. International Value $8,052 11%
VEIEX – V. Emerging Markets Stock Index $7,814 10%
VFICX – V. Int-Term Investment-Grade Bond $7,631 10%
BRSIX – Bridgeway Ultra-Small Market $2,109 3%
Cash – Unreinvested Dividends $500
Total $75,340
 
December and January Fund Transactions
$500 deposited in 401k, not yet invested

Thoughts
Another two months with little activity in my low-maintenance portfolio. I don’t get the joy of reading about my fund picks in magazines, but I don’t worry about choosing the wrong one either.

I am still ironing out a slightly tweaked asset allocation, one that has a more balanced domestic/international distribution and something I hopefully won’t mess with again for a long time. I’m reviewing the model portfolio comparisons and the books they came from, including Ferri’s new book All About Index Funds.

You can see some older posts on how this portfolio came to be here, as well as my previous portfolio snapshots here.

Starting Your Own Portfolio Out With Limited Funds

All of these suggested portfolios were developed by smart people who did their homework. But none of them are the same! This is because every single one also made compromises based on their interpretation of current research, simplicity, availability of suitable investments, costs, and also to some measure their overall predictions of the future. We have to do the same thing on our end.

For example, many people are starting with smaller amounts. Some of these model portfolios have 8 funds or more! Just by the fund minimums alone, you’d be looking at a minimum balance of $24,000 or so. And even then, you’d be looking a various low balance and maintenance fees. So what do you to minimize fees? Here are a few ideas:

1) Buy an all-in-one fund, and split it up later. Since many fund companies have all-in-one target-dated funds, you can simply buy one of these until you have enough to split into other funds. Here are some specific fund suggestions, starting at only $50 per month. The fund’s asset allocation may not be exactly what you want, but it will be well-diversified, and still much better than other high-cost alternatives. Here’s what the Vanguard Target 2045 Fund looks like:

Vanguard Target 2045 Breakdown

I built up about $50,000 in Vanguard Target funds (VTIVX and VTTHX) before splitting it up into 8 funds last year. Since they were held in IRAs/401ks, I didn’t have to worry about any tax consequences. This choice is my favorite because it’s the most simple – just buy the same fund for a few years!
[Read more…]

Model Portfolio #5: A Random Walk Down Wall Street

(This is the fifth in my series of Model Portfolio Comparisons.)

First written in 1973, Burton Malkiel’s A Random Walk Down Wall Street (my review) has become an investing classic, pioneering the controversial idea that stock prices are random and thus a monkey throwing darts would be just accurate as any stock-picker. Below is a recommended asset allocation from the book for an investor in their “mid-twenties”.

Bold Investor Model Portfolio

Asset Allocation Pie Chart, A Random Walk Down Wall Street

Asset Allocation for suggested 75% Stocks/25% Bonds ratio
43% Total US Stock Market
22% Total International Stock Market
10% REIT
20% Treasuries/TIPS/High-Quality Corporate Bonds
5% Cash

This breakdown looks very similar to the basic “Early Saver” portfolio from All About Asset Allocation. See the rest of the model portfolios for example mutual funds and ETFs for each asset classes.

As you age, the recommended percentage of stocks goes down to 65% at age 40 and 40% in late retirement. It is interesting to note that while Malkiel consistently recommends real estate as part of your portfolio, REITs were not explicitly included in the recommended portfolios until recently. I noticed this when comparing my personal copy (published in 1996) to the most recent edition. I’m guessing the growing availability of index funds that track REITs is the reason behind this.