Vanguard Target Retirement Funds Changes: Increased International Exposure

A lot of people own Vanguard Target Retirement 20XX Funds, and I just noticed that Vanguard made an announcement that they will be making some changes:

  • The international equity weighting will be increased to 30% of the overall stock portion fund, up from about 20%.
  • Three of the funds (European Stock Index, Pacific Stock Index, and Emerging Markets Stock Index) will be replaced by a single fund, Vanguard Total International Stock Index Fund.
  • The Total International Stock Index Fund itself is making some changes. Its benchmark index will switch to the MSCI All Country World ex USA Investable Market Index, which differs from the previous index by adding exposure to Canada and Israel, as well as adding a ~13% allocation to small-cap companies.

All of these changes sound good to me, even if it is another example of Vanguard following the herd. The very first target retirement funds had no exposure to Emerging Markets. Emerging got hot, and then Vanguard added to their funds. Investors have been increasing their international exposure as well recently, and 20% was less than their competitors like Fidelity and starting to look old-fashioned. (Perhaps this is another move away from the philosophies of founder Jack Bogle.)

This also means most Target funds will consist of just three funds:

  • Vanguard Total Stock Market Index Fund
  • Vanguard Total International Stock Index Fund
  • Vanguard Total Bond Market II Index Fund

The stated reasons are for increased simplification and diversification (and a little less volatility perhaps), and not for any increase in expected future returns. Here’s a Q&A from Morningstar with Vanguard CIO Gus Sauter about the topic.

I still like this series of all-in-one funds for those people who like the idea of auto-pilot and have all their retirement savings in tax-deferred accounts like 401ks and IRAs. They are simple, reduce your stock exposure gradually over time, keep costs low, and rebalance regularly for you. You can also adjust your risk level by choosing a different target year.

I held the Vanguard Target Retirement 2045 (VTIVX) for a while. After selling it, I’ve found it very easy to let my asset allocation shift.

However, if you have both taxable and tax-deferred investment accounts, splitting up your bonds and stocks for optimal tax-efficiency can help you increase your after-tax returns.

ChoiceTrade: Free Options Trades During Expiration Week

Online broker ChoiceTrade recently announced that they are now offering equity and ETF options trades for zero commission during options expiration week. Expiration week is the week ending with expiration Friday — the week before the third Saturday of each month. Summary of details:

* Zero-commission option trading, once a month, for one week during options expiration week
* A maximum of 500 option contracts can be traded, per household, at the zero-commission rate each month.
* Program includes single-leg and multi-leg trades (spreads).
* Only equity and ETF options qualify.
* Index option trades do not qualify for zero commission option trades. Index option trades will be charged at the normal options commission of $5 per trade, plus $0.55 per contract.
* An account is eligible if the account holder has been qualified to trade options.

I’m not an expert on options trading, but I do know that some folks try to avoid trading as the expiration time nears. Here’s a post from TraderMike about why he doesn’t trade the last two days before expiration (Jim Cramer avoids Fridays). That still leaves Monday through Wednesday, though.

Regular price for options trades is $5 per trade, plus $0.55 per contract. ChoiceTrade recently revamped their website in August with a better web-based trading system, in addition to a platform-based system as well. Rated 4-stars by Barron’s. I’ve mentioned them before as they offer competitive $5 stock/ETF trades including unlimited shares and penny stocks (many brokers don’t).

Missing the Best & Worst Days of the S&P 500


(Click to enlarge.)

Using the SPDR S&P 500 ETF to represent the S&P 500 stock market since the ETF inception in 1993, the chart above shows the effect of:

  • Blue: Holding the entire time. “Buy & Hold”
  • Red: Missing the 10 best days only.
  • Yellow: Missing the 10 worst days only.
  • Green: Missing both the 10 worst days and the 10 best days.

I found this via TheBigPicture, but disagree with the idea that you should try to find out how to miss the 10 worst days avoid the worst days in general. [Edit: See comments for more.] I see no evidence at all that anyone has the ability to predict/avoid the best or worst days ahead of time.

I also don’t agree with the idea that this supports Buy & Hold because you don’t want to miss the 10 best days. Again, if you miss the 10 best, you’re likely to be missing the 10 worst. It works both ways.

The fact that you end up with more money by missing the 10 worst days and less money by missing the 10 best days simply gets a “duh” reaction from me. The bigger divergence recently just reaffirms that prices have been a lot more volatile in the last couple of years.

Instead, the focus should be on that fact that if you take out both the 10 worst days and the 10 best days, you’ll basically do just as fine as buy & hold. Stock market investing is chaotic and tough on the stomach if you watch all the swings. If you take out the swings, you still get the same results! But you can’t in reality take out the swings, so the best thing is to try and ignore them.

I don’t want to spend my life competing against Wall Street whiz kids and supercomputer trading algorithms, so I just invest passively with rock-bottom costs. Work on your career or build a business… put your energy into something in which you have more control.

Behind The Scenes: No Transaction Fee (NTF) Fund Supermarkets

After the Bogle/Hennessy squabble (here’s the latest), I’ve been digging for more details about mutual fund “supermarkets” where you can buy funds from various managers all with no transaction fee (NTF)… but at a cost. Charles Schwab introduced the concept first in the 1980s. Today, the Big 3 of fund supermarkets are:

  • Charles Schwab with 2,000+ NTF funds,
  • Fidelity Investments with 1,400+ NTF funds, and
  • TD Amertrade with 1,600+ NTF funds

How They Work

Each of these brokers currently charge fund companies 0.40% annually of their fund assets owned through their specific NTF network. So, if a mutual fund XXXXX had $200 million of assets total but only $100 million was through Schwab, they’d have to pay 0.4% of $100m ($400k) a year to Schwab. The fund has to then pass this cost onto investors. However, the annual expense ratio charged to fund investors has to be the same for everyone, no matter where they hold the fund. Therefore, the investors that own the fund through cheaper or more direct means are effectively subsidizing the NTF investors.

Result: Although they are cheaper to buy and sell, NTF funds tend to be more expensive when you look at their annual expense ratios.

TD Ameritrade raised their fee from 0.35% to 0.40% in April 2010 to match the other two, according to this InvestmentNews article. There is speculation now if this means Fidelity and Schwab may raise their rates again as well. Part of this is due to the fact that after the recent financial crisis there is even less competition, due to closures and mergers. (TD Ameritrade itself is a result of a merger of TD Waterhouse and Ameritrade .)

From this Kiplinger’s article, NTF funds can also hurt your net performance in other ways:

NTF funds typically receive a tidal wave of money when performance is red-hot. The money flows out just as rapidly when returns cool. That swift ebb and flow of dollars hurts a fund’s long-term returns because it forces managers to buy and sell securities at times when they may be better off doing the opposite. In-flows and out-flows are usually much less volatile for funds that are outside NTF networks.

The Convenience Factor

If you’re a small fund company, it’s probably a lot of work to sell directly to shareholders, and also you lack the marketing might of the big brokers. From a investor point-of-view, beyond avoiding any transaction fees, we also love convenience. From this RIABiz article:

Schwab and its rivals have gotten a stranglehold on the distribution of mutual funds because they are in the best position to provide the convenience of one-stop shopping and one-statement viewing that no individual mutual fund company ever could.

“It is true that investors can go direct to many of the larger fund families, but they give up a consolidated view of their accounts when they do that,” Ellis says. “We know that clients value that single report that shows all their holdings.”

If You Don’t Pay, You Can’t Be A Top Pick

Each of the brokers has their own “preferred” set of funds that they promote to their customers. Well, you can’t be one of these funds unless you pay the money to be in their NTF platform. Check out Fund Picks from Fidelity, OneSource Select from Schwab, and the Premier List from TD Ameritrade.

Yup, they are “specially screened” alright… and the first screen is if the check cleared… Pay to play.

Do Huge Funds Get Special Discounts?

What about the big boys? Are these fees set in stone or is their a discount for funds with huge assets? Apparently, TD Ameritrade is much more flexible than the others. Perhaps that has helped them grow so fast. From the same InvestmentNews article:

TD Ameritrade is negotiating with fund companies that have low expense ratios and can’t afford the new fee, said one fund company official familiar with the situation, who asked not to be identified. Schwab and Fidelity are not as flexible, the official said.

More proof of this is that T. Rowe Price is now a NTF fund at TD Ameritrade. From the MutualFundWire article Did TD Give T. Rowe a Deal?:

In the past, T. Rowe Price has been reticent to join the NTF platforms, preferring to have shareholders who purchase shares through the marts to pay the transaction fee thereby keeping shareholders who buy directly from subsidizing the sales. T. Rowe Price’s brand is popular with advisors, which may give it a leg up in negotiations with the mutual fund supermarkets, say industry insiders.

A source familiar with the situation said T. Rowe Price is paying “significantly less than 40 bps” TD Ameritrade has been charging other mutual fund firms since early this year when it raised its fee from 35 bps. Just how much less than 40 bps the fund firm is paying could not be learned.

T. Rowe Price is known for their relatively low fees on their actively-managed mutual funds, which combined with their good past performance has created a very strong following of investors and financial advisors. I’m not sure if I would see this as a good or bad thing. If they can increase asset size without hurting performance, then in theory TRP can maintain their low costs for all investors. I guess we’ll see.

Fund Families Fight Back?

As fees keep rising, an analyst from the RIABiz article mentioned above thinks small funds may band together to revolt:

“As fees increase and the platforms capture more of the value stream, I would not be surprised to see smaller mutual fund families, faced with extinction, combining into a sort of ‘open architecture fund warehouse,’ and pull their diminished fund sales from the platforms,” he says. “A fund co-op could undercut Fidelity, Schwab and TD Ameritrade while still providing a single report.”

I think this would be awesome, and relatively easy to set up in this digital age. Good idea for a start-up?

Vote With Your Money

It’s interesting to see how such funds are distributed and promoted behind the scenes, but in the end it is up to us investors to vote with our money. If you think it’s worth it to buy NTF funds through one of these brokers, then you can continue doing so. But look around, there may be similar funds out there that are cheaper to own. Look at fund companies like Vanguard, PIMCO, and Dodge & Cox that don’t do NTF hardly anywhere. In addition, smaller fund supermarkets like E-Trade may charge less and thus offer a more options.

Mutual Fund Supermarkets Charge 40 Basis Points?

In a recent Wall Street Journal Op-Ed article by Vanguard founder Jack Bogle, he reaffirmed studies like the one from Morningstar showing that one of the strongest predictors of mutual fund performance is how low their annual expense ratios are. In addition, he shared data that fees on actively-managed funds continue to rise despite increasing asset sizes:

Conclusion: The huge economies of scale available in managing other people’s money have largely been arrogated by fund managers to their own benefit rather than to the benefit of fund shareholders.

In a letter to the Editor, Neil Hennessy, president and chief executive of fund manager Hennessy Advisors Inc. shot back, listing his own reasons for keeping his fund fees north of 1% (100 basis points) annually.

For one of our typical funds, federal and state registration fees have increased 44%, legal fees have increased 73%, and audit fees have increased 30%. […] Also, while no-transaction fee platforms didn’t exist in the 1960s, today funds pay as much as 40 basis points to be on the platforms offered by the likes of The Charles Schwab Corp. and Fidelity Investments.

According to this Investment News article, other mutual fund managers also feel this way.

His grievances are shared by many in the fund industry, said Don Phillips, a managing director at Morningstar.

“I think a lot of people would be afraid to do what Neil did and that is to out the distributors,” he said. “The asset managers are taking all the blame for high fund expenses, while the distributors are completely off the radar.”

I thought this was an interesting debate. I had no idea it cost that much for smaller mutual funds to get the accessibility of being part of a mutual fund “supermarket” like Schwab or Fidelity. However, that cost does allow investors to buy the funds with no transaction fee (NTF) at these places, which no doubt encourages more activity. In the long run though, 40 basis points is a huge ongoing drag. Here is an old 2004 Forbes article I found on fund supermarkets that also confirms the 35-40 basis point number.

I logged into Fidelity and found that all 10 non-institutional Hennessy retail funds were on the Fidelity NTF list. However, their expense ratios were also in the 1.30% to 1.70% range – well above average even for active funds. Hennessy isn’t exactly doing all they can to save money for the investor.

It would be nice if smaller mutual funds had a more open marketplace to distribute themselves, since it would seem a huge percent of their cost is just marketing. Of course, that’s also true for a lot of other things we buy, from breakfast cereal to basketball shoes. At the very least, an investor should always try to buy direct from the fund provider whenever possible.

In the end, I’m happy that I can buy most of my mutual funds “wholesale” from Vanguard with their at-cost philosophy, along with some “loss-leader” index funds from Fidelity. Shop smart! 🙂

Hat tip to Barry Barnitz of Bogleheads.

LendingClub Investment Criteria – What Loans To Avoid?

LendingClub.com (LC) is a website that securitizes person-to-person loans so that you can lend money to other people in as little as $25 increments, and you earn the interest. The idea is to replace banks and credit cards as the major middlemen used for lending. Here’s an illustration from their site:

Now, if you read my previous posts on LendingClub, you know I’m skeptical about getting 9.5% returns in the long run. My LendingClub Net Annualized Return is currently 6.8% after fees. If I can stay in the 4-6% range, I’d be happy as I view this activity as a hobby. My favorite loan so far is helping a young couple purchase a tiny 200 sf house-on-wheels.

The investment process is set up such that LC examines the loan application and assigns it a credit grade with an interest rate from 6.39% – 21.64%. All you have to decide is whether to fund the loan or not in increments of $25. You can’t change the rate. Therefore, the key is to quickly fund the relatively attractive loans and avoid the unattractive ones.

You can view historical performance data at the LC website, but it is very raw. I recently came across a new site called LendStats.com that has been sorting through the data and presenting it in some very insightful ways. The owner KenL uses a nice, simple formula for return on investment (ROI) and one can see from the data several ways to improve your returns.

Loan Factors To Avoid

Business loans. If you look at all the loan categories, only the ones under the Educational and Small Business categories have negative ROIs. (Educational loans have a much smaller sample size.) In general, perhaps it is a form of adverse selection when someone with a business idea must resort to making a personally-backed loan from strangers to fund their idea. Also, it may be that the economy is so tough that only select new businesses survive.

Borrowers with mortgages. Until recently, a mortgage holder was deemed more credit-worthy than a renter. That person had to have the means to make a 20% down payment and pass underwriting from a bank. Now, with so many people underwater in their homes, the ROI from renters is higher than mortgage-holders. Renters have greater flexibility with their cashflow. I suspect many people find themselves so bogged down by their mortgages that they decide to simply declare bankruptcy and forget about all their other debts as well.

Loan amounts greater than $20,000. Loans over $25k have a negative ROI overall, with $20k loans not doing much better. Bigger loans means bigger risk, which apparently isn’t adequately compensated for by higher interest rates. Also, I am wary of people doing the “borrow-and-bankrupt” route where they try to amass as much debt as they can and then declare bankruptcy after either a huge party, leaving the country, or hiding assets.

Borrowers with more than 2 credit inquiries within last 6 months. Average ROI consistently goes down as the number of inquiries on your credit report goes up. This indicates that you are also trying to get credit from others, and thus your debt-to-income may be higher than reported. In general, this also increases the likelihood of either desperation, fraud, and/or impending crisis.

Any F and G rated loans. The general trend is still supporting my original plan of only buying the highest-rated A loans, however there are some improvements in the B through E grades. Loans with the lowest grades of F and G continue to have negative ROIs. These are also the loans with the smallest sample size, but since there are so few of them anyway I find it easier to simply avoid them.

2010 Q3 Investment Portfolio Update – Fund Holdings

I’ve already posted my target asset allocation, now here’s my actual portfolio holdings. Again, these are my own choices, governed by the size of my tax-advantaged accounts like IRAs/403b/401ks, the brokerage firms that I use, and my preference of passive management and low fees. Even with the explosion of new blogs, I still don’t see very many people sharing their actual holdings. I hope that if I share, then others will share as well. 🙂

Tax-Efficient Placement

One big change for me over the last two years is that I now run out of room in my IRAs and 401ks each year and now have money sitting in taxable accounts. Since each asset class is taxed differently, where you put your assets can make a big difference in your net return. As a result, I’ve moved some things around. Here’s a handy graphic taken from a post about tax-efficient fund placement:

Chart of Relative Tax Efficiency of Assets

Stocks

US Total Market
I used to own Vanguard Total Stock Market Index Fund (VTSMX) but recently converted that to the ETF share version Vanguard Total Stock Market ETF (VTI) due to the lower 0.07% annual expense ratio. This fund tracks the MSCI US Broad Market Index, and typically holds the largest 1,200–1,300 stocks (covering nearly 95% of the index’s total market capitalization) and a representative sample of the remaining stocks. It currently holds 3,391 different companies. All for $7 a year for each $10,000 hold.

In my 401k, since I have limited options, I hold a mix of 75% Diversified Stock Index Institutional Fund (DISFX) which is basically a S&P 500 fund and 25% Fidelity Spartan Extended Market Index Fund (FSEMX) as it tracks the entire market minus the S&P 500. Together, the track the overall US market very well, at only a slightly higher cost of a weighted 0.25%.

US Small Cap Value
Here, I still hold the Vanguard Small-Cap Value Index Fund (VISVX). I could convert to the Vanguard Small-Cap Value ETF (VBR) with identical holdings and a lower expense ratio of 0.14% vs. 0.28%, but since it is only 5% of my portfolio I haven’t yet. In addition, there are good arguments for alternative ETFs such as iShares Russell 2000 Value Index ETF (IWN) or iShares S&P SmallCap 600 Value Index ETF (IJS). They each track slightly different indices and thus hold different stocks. Something to analyze deeper at a later time.

REIT
I still hold the Vanguard REIT Index Fund (VGSIX) as opposed to the Vanguard REIT ETF (VNQ). Both track the MSCI® US REIT Index. I hold this inside my IRA, so I’d rather just have full investment rather than worry about partial shares and such.

International / Total World excluding US
I used to hold Fidelity Spartan International Index Fund (FSIIX) but now hold the Vanguard FTSE All-World ex-US ETF (VEU) which tracks the FTSE All-World ex US Index and holds 2,239 stocks from around the world. There is the equivalent Vanguard FTSE All-World ex-US Index Fund (VFWIX) but since this is a bigger holding for me, the cheaper expense ratio makes a difference.

Emerging Markets
I converted to the Vanguard Emerging Markets ETF (VWO) from the Vanguard Emerging Markets Stock Index Fund (VEIEX). Even though my overall investment here is low, VEIEX has both a 0.25% redemption fee, and a 0.50% purchase fee, which is just too annoying to stay there. Another option would have been the iShares MSCI Emerging Markets Index (EEM), but it is both more expensive and has had more tracking issues. Here’s a EEM vs. VWO comparison post.

Bonds

Short-Term High Quality Bonds
I used to own the Vanguard Short-Term Treasury Fund Investor Shares (VFISX) but it now only yields 0.41% with an average duration of 2.2 years. If you had an IRA at certain banks, you could buy a CD earning 2-3% over the same time horizon. It would be just as safe. There would be less liquidity, but I’m not really concerned about that. The CD would be even better because you can’t lose what you put in.

I’ve actually gone ahead an put this portion of my portfolio in a stable value fund inside my 401k. I explored the risks and rewards of stable value funds, and while they are not of the utmost safety, the worst-case scenario is on the same order of the worst-case scenario of many short-term bond funds. My stable value fund is earning 3.5% for all of 2010.

I’ve also been looking at municipal bond funds such as the Vanguard Limited-Term Tax-Exempt Fund (VMLTX) and Vanguard Intermediate-Term Tax-Exempt Fund (VWITX) since they are mostly rated AA and above with interest being federally tax-exempt. If I lived in California and had a big bond allocation, I’d still consider a partial holding in the Vanguard California Intermediate-Term Tax-Exempt Fund (VCAIX) since the interest is higher and is exempt from both federal and CA income tax. I wrote about VCAIX in late 2009 when the yield was 3.49%. It’s done quite well since then, although California’s still got major issues to work out. If I lived in New York, I’d consider the same for NY funds.

Inflation-Protected Bonds (TIPS)
Here, the only thing to buy is either individual TIPS bonds or a mutual fund/ETF holding TIPS bonds. Usually buying individual bonds is risky because you aren’t spreading the default risk across hundreds of issuers, but in this case every single bond is just as safe and backed by the US government.

I have my Self-Employed 401k at Fidelity, which allows me to buy individual TIPS with no commission (just bid/ask spread). I bought some longer-term TIPS with real yields of 2-3%, and they’ve been doing well since real yields have dropped since. In addition, I hold shares of the iShares Barclays TIPS Bond ETF (TIP) because I can trade iShares ETFs commission-free at Fidelity.

The Vanguard Inflation-Protected Securities Fund Investor Shares (VIPSX) was also considered, along with new TIPS ETFs that have different maturities such as the PIMCO 15+ Year U.S. TIPS Index ETF (LTPZ).

OptionsXpress Review: Application, Broker Commissions, Trading Features, $100 Bonus

OptionsXpress.com (OX) is a online brokerage site that specialized in options and futures trading, but has since expanded their offering to be one-stop-shop – offering stocks, bonds, brokered CDs, and mutual funds. Like some of you, I signed up a while back when they were offering a fat bonus (very limited-time offer). Since I have an account, here’s a user’s review of the broker.

Application

The online application is of the usual brokerage sort, with questions about your job, trading style, and any potential conflicts of interest. You can fill in most of your details online but you must still mail in a signed form to start trading. There is no minimum opening balance required for a cash account ($2,000 min for margin), but you can fund initially via electronic transfer, wire, or check.

Commissions and Fees

Stocks and ETFs are $9.95 per trade (market or limit, up to 1,000 shares), which is basically average now in the discount broker world. Broker-assisted trades are no additional charge, which is nice. Mutual fund trades are also $9.95.

Where OX is more competitive is in the options trading area. On their lower tier (0–34 trades/quarter), you can get 10 contracts for $15 with no base rate. They say that the average options trader trades 20 times a year, 10 lots at a time. Here’s their graphic how that stacks up:

No minimum account balances, no account maintenance fees, and no inactivity fees. Streaming real-time quotes are also free.

Cash Management

OX has a basic and functional ACH funds transfer system for electronic transfers to a linked bank account, which is free for deposits and withdrawals. You can add additional linked banks online via the trial deposit method. All ACH deposit requests must be received by 3:30pm ET to be processed same business day. All other requests will be processed on the following business day. ACH deposits will be available for trading on the third business day after processing. If you send them actual bank statement, you can arrange for next-business day availability of funds.

Free checkwriting is available on accounts open at least 6 weeks with $5000 minimum equity balance.

Their FDIC-insured cash sweep account currently yields a tiny 0.02%, but sadly that’s also about average for the industry right now.

Features

While they aren’t the cheapest, here are some features that differentiate them.

MyOX
If you are a very active trader, you are familiar with proprietary software by software-based brokers. MyOX works inside a regular web browser, but still enables you to customize the trading interface with widgets that you prefer. The best way to describe it is if you use iGoogle where you can move around modules with drag-and-drop. You can have your watchlist, charts, RSS news fees, etc. Here’s a screenshot of how I had mine set up:

Customer Service
OX offers live chat Mon-Fri, 8am-10pm ET and Sat, 10am-2pm ET which is much later than market hours. Their general support line (888) 280-8020 is also open until 10pm Eastern. I don’t live on the East Coast so I found this very convenient.

XpressRouter – Improved Order Routing
A big concern when you go with a discount broker is the getting the best execution of your orders. How do you know you couldn’t have gotten $45.25 per share instead of $45.18? Times 100 shares, that’s $7 right there. They use what they call XpressRouter to routing your trade between several options and get the best execution. NBBO is National Best Bid and Offer.

At optionsXpress, you can be sure to get the NBBO on any eligible trade. We guarantee the best price or we’ll credit your commission. If you see a possible discrepancy, let us know immediately after you get the electronic confirmation of the execution. Our commitment is to provide the quickest execution at a reasonable price so you can trade with confidence.

$100 Sign-Up Bonus
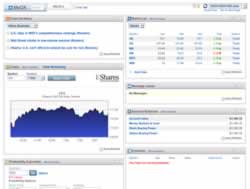
OptionsXpress has a current promotion offering new customers a $100 bonus if they open an account with at least $500 and make 3 trades with a year.

Offer is valid for one new Individual or Joint optionsXpress account opened and funded with at least $500 by US residents on or before December 31, 2011 at 11:59 CST, and having executed 3 trades within twelve months of account opening. To receive $100 bonus, account must be funded with at least $500 cash or securities transferred from a brokerage firm other than optionsXpress. The $100 bonus will be deposited into the new optionsXpress account within one month after meeting the terms and conditions of this offer. optionsXpress may charge the account for the cost of the $100 bonus should account fail to remain open with minimum funding (excluding trading losses) 6 months from the account open date.

Since their overall price structure isn’t rock bottom, this bonus it will let you open an account and trade several options contracts for free to see if you like it.

Target Asset Allocation for Investment Portfolio

Asset allocation (AA) is an important part of portfolio design, and I like pinning down a target asset allocation for personal reference. This helps keep me focused as my portfolio shifts over time and makes it easy to re-balance back. For some educational posts on this topic, please refer to my asset allocation starter guide.

Below is my updated target asset allocation. Here is my target asset allocation from 2008. It’s not dramatically different, but I’ll try to explain the slight changes below. This is just my own AA, and I think everyone should develop their own based on their own beliefs and learning. If you just copy someone else’s without thinking, when things go awry you won’t have the foundation to stick to your guns. I have been strongly influenced by the writings of Jack Bogle, William Bernstein, David Swensen, Rick Ferri, and Larry Swedroe.

Stocks

I separate things out first into stocks and bonds, and then later it’s easy to go 60% stocks/40% bonds and so on. Here’s my stocks-only breakdown:

  • I now do a 50/50 split between US and International stocks. In general, I would like to mimic the overall world investment landscape. On a market cap basis, the US stock market is now about 45% of the world, while everyone else takes up 55%. 50/50 is just simpler, with a slight tilt towards domestic stocks.
  • I consider REITs a separate real estate asset class. I used to put Real Estate under US stocks since I only held US Real Estate Investment Trusts (REITs), but in the future I would be open to investing in foreign real estate as property laws improve and investing costs drop.
  • On the US side, I add some extra small-cap value companies. Historically, adding stocks of smaller companies with value characteristics (as opposed to growth) has improved the returns of portfolios while lowering volatility. There is debate amongst portfolio theories as to why this happened and if it will continue.

    If you buy a “total market” mutual fund or ETF, you’ll already own many of these types of companies (although many will not be held due to their small size relative to the big mega-corporations). I feel this adds a bit of diversification.

  • On the international side, I add a little extra exposure to emerging markets. You may be surprised to know that “emerging” countries like China, Brazil, Korea, India, Russia, and Taiwan already make up 26% of the world’s markets when you remove the US. These are countries that have a greater potential for growth, but also lots of ups and downs. I add a little bit more than market weight for these as well.

Bonds

I try to keep things simple for bonds, partially due to the fact that they are currently a smaller portion of my portfolio.

  • I like a 50/50 split between inflation-linked bonds and nominal bonds. Inflation-protected bonds provide a yield that is guaranteed to be a certain level above inflation. Nominal bonds pay a stated rate that is not adjusted for inflation. I like to balance the benefits of both.
  • Instead of only short-term US Treasuries for nominal bonds, I added some flexibility. I used to invest only in short-term US treasuries, as they provided the best buffer in my portfolio as they were of the highest quality and had a low sensitivity to interest rate fluctuations. Both TIPS and nominal Treasuries did great during the 2009 crash and the subsequent flight-to-quality, but now the yield on Treasuries is just too low in my opinion. There are trillions of dollars from countries and huge institutions around the world that are tucking their money away under the safe Treasury mattress. By venturing into other places they won’t with my tiny portfolio, I feel I can stay relatively safe yet increase my yield significantly. Possibilities include bank CDs, stable value funds, and high-quality municipal bonds.

Want more examples? Here are 8 model portfolios from respected sources, an updated Swensen portfolio, one from PIMCO’s El-Erian, and Ferri’s personal portfolio. Have fun!

My First Shares Of Stock Ever Purchased

I was going through some old financial files and came across an old E-Trade statement which was my first brokerage account and found my first shares of stocks ever purchased in August of 2001. This was after the dot-com bubble burst, and I was still in grad school. I had managed to save up $1,000 and promptly invested it after pretty much zero research:

  • 11 shares of Budweisder (BUD) at $43.04. Budweiser was bought by foreign conglomerate InBev in 2008 at $70 a share, but after that I’m not sure how to evaluate performance.
  • 12 shares of Pfizer (PFE) at $38.31. As of yesterday 9/2/10, PFE closed at $16.40 with about $0.75 to $1.25 a year in dividends.

People were pretty depressed about the markets back too, so I guess I figured beer and happy pills was a growth industry. 🙂

Do you have any special memories attached to your first stock purchase?

Updated 529 College Savings Asset Allocation: Added Stocks, 10-Year 5% APY CD

Since we’re on the topic of college tuitions, I have recently adjusted the investment mix in my Ohio CollegeAdvantage 529 Plan. As I’ve mentioned before, I choose a very conservative mix because I think a 20-year or less horizon with a 4-year or less withdrawal period is actually a pretty short horizon. I just want to see gradual but reliable increases in my balances. In contrast, I view retirement as a 30 year horizon with another 20-30 year withdrawal period.

Previous Asset Allocation

My original asset allocation was 100% Treasury Inflation-Protected Securities (TIPS) through the Ohio 529’s Vanguard Inflation-Protected Bond Option which is essentially the Vanguard Inflation-Protected Securities Fund (VIPSX) with a slightly higher expense ratio. Back in 2009, I ran a comparison of the CollegeSure Tuition-Indexed CDs vs. Inflation-Protected Bonds, and picked TIPS. However, back then the real yield was 1.7%, and it is now 0.49%. Accordingly, the fund has a pretty good performance since then.

Updated Asset Allocation

20% Stocks (simple low-cost index option)
40% Inflation-protected bonds
40% Bank CD 10-year initial term, paying 5% APY.

Adding Stocks

The reason I chose to add stocks is that historically, adding 20% of stocks to a portfolio has actually reduced volatility while increasing returns. Here is a chart from my Choosing An Asset Allocation series of posts. As I get closer to college start date, this 20% portion will go down to zero.

altext

Adding a 5% Bank Certificate of Deposit

Right now, a regular nominal 10-year Treasury Bond yields less than 2.50%. The real yield on a 10-Year TIPS bond is 0.95%, so the market is basically predicting inflation over the next 10 years to be about 1.50% annually.

However, the Ohio 529 plan offers a FDIC-insured certificate of deposit with a 10-year term earning 5% APY through Fifth Third Bank. (Heads up via Bogleheads.) That’s quite a big boost in yield. For every $10,000 I put in today, I’m guaranteed over $15,000 in 10 years. Early-withdrawal penalties are steep at half of accrued interest, so I had to be sure I wouldn’t need the money sooner.

As long as the real yield on the TIPS fund stays below 1%, then as long as inflation stays below 4% over the next decade the CD will win out over TIPS. If inflation somehow goes nuts, then the TIPS will keep the portfolio from falling too far behind. (Hopefully the stocks will help out as well.)

Since these are all in a 529 plans, the gains will be tax-free if used for qualified college expenses, which is good because otherwise federal and state taxes on a bank CD would be pretty high for us.

LendingClub P2P Loan Investment Returns Update 2010 Q3

LendingClub.com is a website that securitizes person-to-person loans so that you can lend money to other people in as little as $25 increments, and you collect the interest after some fees. The idea is to replace banks and credit cards as the major middlemen used for lending. “Investors earn better returns, borrowers pay lower rates.” I’ve been investing some money with them since they started in 2007.

Last time I wrote about LendingClub in May, I expressed concerns about their historical performance data living up to their marketed 9.65% returns and then LendingClub responded on why they thought things weren’t that bad. It’s been 3 months, so I figure it’s a good time for another update.

The first part of their argument is that they think that loan performance over time will go like this, with a drop and then significant recovery near the end of the term:

However, I don’t see that behavior happening. As you can see below, the older the loans, the lower the overall performance. Returns just keep dropping for loans going from 1.5 to 3 years old. There is no rise or recovery at the end of the three-year term. Data was taken from actual LC loans with observation date of August 17th, 2010.

Loans Originating Second Half of 2008 (about 1.5-2 years old)

Loans Originating First Half of 2008 (about 2-2.5 years old)

Loans Originating 6/1/2007 to 12/31/2007 (about 2.5-3 years old)


Note the change in the y-axis scale

Now, the next part of their argument was that all the loans that originated before they changed their credit requirements and interest rates at the end of 2008 weren’t a valid data set to be analyzing. (That doesn’t make me feel much better because as an early adopter, I hold a lot of those loans.) While improved underwriting may make the average returns higher, I don’t see why it should affect the overall performance behavior over time.

2009+ Loans Only

Okay, so the newer vintage loans that originated after January 1st, 2009 take into account their current lending criteria. In the end, we’ll just have to see if people really get higher returns. From now on, I’m going to try and track the performance every quarter. Here is the performance of loans originating in the first half of 2009, as of August 17th, 2010. Since it a loan has to be late for 4 months to be actually considered in default, this means the loans only have effective ages of 1 to 1.5 years.

So far, not too bad at about 8% return. Here is the performance of loans originating in the first quarter of 2009 with two observation dates (May 2010 and August 2010) overlaid on top of each other. You can see that the loan performance has decreased slightly over the last 3 months. I hope that I am wrong, and that the performance does start to improve.

You may call me a LendingClub basher, but I still consider myself an active investor and supporter. I want them to have awesome returns, but the data simply doesn’t support the likelihood of earning 9.5% annually. Investors should go into it with realistic expectations, and ideally an interest in P2P social lending. Despite this, if LendingClub can average, say 6% returns going forward, that would still be quite an accomplishment for this new business model. I know I’d be happy with that.

To Prospective Borrowers
Honestly, LendingClub is more attractive as an option for borrowing money and/or credit card debt consolidation. You can borrow up to $25,000 and you can know your rate before actually applying for the loan. If the rate quote they give you can be beaten elsewhere, then just walk away with no obligation. When writing your loan application, try to include as much applicable information as possible (reason for loan, how will you repay, monthly budget breakdown) and answer all lender questions promptly for the best results.