LendingClub P2P Loan Investment Returns Update 2010 Q3

LendingClub.com is a website that securitizes person-to-person loans so that you can lend money to other people in as little as $25 increments, and you collect the interest after some fees. The idea is to replace banks and credit cards as the major middlemen used for lending. “Investors earn better returns, borrowers pay lower rates.” I’ve been investing some money with them since they started in 2007.

Last time I wrote about LendingClub in May, I expressed concerns about their historical performance data living up to their marketed 9.65% returns and then LendingClub responded on why they thought things weren’t that bad. It’s been 3 months, so I figure it’s a good time for another update.

The first part of their argument is that they think that loan performance over time will go like this, with a drop and then significant recovery near the end of the term:

However, I don’t see that behavior happening. As you can see below, the older the loans, the lower the overall performance. Returns just keep dropping for loans going from 1.5 to 3 years old. There is no rise or recovery at the end of the three-year term. Data was taken from actual LC loans with observation date of August 17th, 2010.

Loans Originating Second Half of 2008 (about 1.5-2 years old)

Loans Originating First Half of 2008 (about 2-2.5 years old)

Loans Originating 6/1/2007 to 12/31/2007 (about 2.5-3 years old)


Note the change in the y-axis scale

Now, the next part of their argument was that all the loans that originated before they changed their credit requirements and interest rates at the end of 2008 weren’t a valid data set to be analyzing. (That doesn’t make me feel much better because as an early adopter, I hold a lot of those loans.) While improved underwriting may make the average returns higher, I don’t see why it should affect the overall performance behavior over time.

2009+ Loans Only

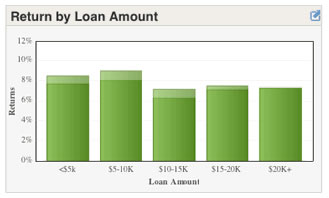
Okay, so the newer vintage loans that originated after January 1st, 2009 take into account their current lending criteria. In the end, we’ll just have to see if people really get higher returns. From now on, I’m going to try and track the performance every quarter. Here is the performance of loans originating in the first half of 2009, as of August 17th, 2010. Since it a loan has to be late for 4 months to be actually considered in default, this means the loans only have effective ages of 1 to 1.5 years.

So far, not too bad at about 8% return. Here is the performance of loans originating in the first quarter of 2009 with two observation dates (May 2010 and August 2010) overlaid on top of each other. You can see that the loan performance has decreased slightly over the last 3 months. I hope that I am wrong, and that the performance does start to improve.

You may call me a LendingClub basher, but I still consider myself an active investor and supporter. I want them to have awesome returns, but the data simply doesn’t support the likelihood of earning 9.5% annually. Investors should go into it with realistic expectations, and ideally an interest in P2P social lending. Despite this, if LendingClub can average, say 6% returns going forward, that would still be quite an accomplishment for this new business model. I know I’d be happy with that.

To Prospective Borrowers
Honestly, LendingClub is more attractive as an option for borrowing money and/or credit card debt consolidation. You can borrow up to $25,000 and you can know your rate before actually applying for the loan. If the rate quote they give you can be beaten elsewhere, then just walk away with no obligation. When writing your loan application, try to include as much applicable information as possible (reason for loan, how will you repay, monthly budget breakdown) and answer all lender questions promptly for the best results.

Morningstar Admits Fund Expenses More Important Than Star Ratings

A funny thing happened when Morningstar performed a study on whether expense ratios or Morningstar “star” ratings are better at predicting higher future mutual fund returns. Expense ratios won. Russel Kinnel, Morningstar’s director of mutual fund research and study author, wrote about the study results on Morningstar and these quotes sum it up:

If there’s anything in the whole world of mutual funds that you can take to the bank, it’s that expense ratios help you make a better decision. In every single time period and data point tested, low-cost funds beat high-cost funds. […] Investors should make expense ratios a primary test in fund selection. They are still the most dependable predictor of performance.

The study didn’t look very far back, but it probably couldn’t because Morningstar keeps trying to tweak its rating system into something that… um… works. 😉 So they looked at the star ratings and expense ratios from mutual funds from 2005 through 2008, and then tracked their progress through March 2010. Funds were categorized into five broad asset classes: domestic stocks, international stocks, balanced, taxable bonds and municipal bonds.

The Morningstar rating system didn’t do awful. But considering that expense ratios are one single number, and Morningstar has millions of dollars available to make their rating system work by crunching historical data and take into account whatever multiple factors they want, it must be pretty depressing for them.

Heck, one of those recent tweaks was specifically to factor in expenses as part of the rating system. In the end, Morningstar ratings are still primarily based on past performance. Another quote from the article:

Perhaps the most compelling argument for expenses is that they worked every time–because costs always are deducted from returns regardless of the market environment. The star rating, as a reflection of past risk-adjusted performance, is more time-period dependent.

Is it just me, or does “time-period dependent” sound a lot of like “it works sometimes, except when it doesn’t”?

Investing based solely on past performance is as someone said, “like driving down a winding road using only your rear-view mirror”. Using the same driving analogy, I feel that investing with very low costs is like racing with a constant breeze at your back. (Or more accurately, all your opponents are driving into a constant headwind.) Over time, this relentless advantage will lead to above-average returns.

Next time you see an mutual fund ad touting their 4-star or 4-star ratings, just ignore it.

More media coverage: Associated Press, NY Times, CBS MarketWatch

Portfolio Manager Rick Ferri Shares Personal Portfolio and Asset Allocation

In a recent post on the NY Times Bucks blog, portfolio manager and author Richard Ferri shared his own personal portfolio. As a proponent of low-cost, passive investing, it was not surprising to see mostly index funds in his portfolio, but it was interesting to see that his overall asset allocation is 80% stocks and 20% bonds. He is quick to note that he does have a pension and defined-benefit plans which balance out his overall financial picture. Wouldn’t you like to know what all those financial advisors out there actually own?

Asset Allocation

Here is his asset allocation broken down into stocks and bonds separately using pretty pie charts:

Stocks

Bonds

Here’s the overall 80/20 breakdown with ticker symbols (based on this Bogleheads post):

34% Vanguard Total Stock Market ETF (VTI)
10% S&P SmallCap 600 Value Index Fund (IJS)
5% Ultra-Small Company Market (BRSIX)
8% Vanguard REIT ETF (VNQ)

6.5% Vanguard Pacific ETF (VPL)
6.5% Vanguard European ETF (VGK)
5% DFA International Small Cap Value
5% DFA Emerging Markets Core
—- [alternative: Vanguard Emerging Markets ETF (VWO)]

12% Vanguard Total Bond Market Index Fund Investor Shares (VBMFX)
4% Vanguard Inflation-Protected Securities Fund Investor Shares (VIPSX)
4% Vanguard High-Yield Corporate Fund Investor Shares (VWEHX)

Reading his book All About Asset Allocation was very helpful in creating my own portfolio. (Also see Model Portfolio #3 taken from that book.) I haven’t been updating my own own portfolio asset allocation as diligently as I should, although I have been keeping track of it. Here’s the last snapshot I took:

Pie Chart of Investment Portfolio

I’ve had some asset allocation drift for sure, although I have been countering this by rebalancing with new funds. I really need an update…

Emergency Funds

It’s also interesting to note that he keeps an emergency fund of two years’ living expenses, and that he uses the Vanguard Short-Term Bond (BSV) with a current SEC yield of 1.08%. Very simple and almost no-maintenance.

I prefer using a mix of high interest savings accounts and longer-term CDs/rewards-type checking accounts. I figure that index fund investors get so excited by saving 10 basis points (0.10%) on mutual fund, but with a bit of work you could beat a short-term bond fund by 100 basis points (1%) with what I would call less risk.

Bond funds still have risk to principal, meaning you may have to sell for less than you bought in for, while FDIC-insured bank accounts do not. Money market funds are currently averaging less than 0.10% yield.

TradeKing $50 New Account Bonus: No Promo Code or Referral Required

Online discount broker TradeKing has brought back their $50 sign-up bonus for new accounts, no promotional code or referral required. You must open with $2,500 and make one trade within 30 days. Offer expires 1/31/11.

To qualify for this offer, new accounts must be opened and funded with $2,500 or more. Account funding must occur within 30 days of account opening, and one trade must be executed within 180 days of account opening, for account to qualify. Offer is not transferable or valid in conjunction with any other offer. Open to US residents only. One offer per household. TradeKing can modify or discontinue this offer at anytime without notice. The minimum funds of $2,500 must remain in the account (minus any trading losses) for a minimum of 6 months or the credit may be surrendered.

If you transfer an account of $2,500 value or greater over to TradeKing, they will also refund up to $150 in account transfer fees charged by your old broker.

TradeKing will credit your account transfer fees up to $150 charged by another brokerage firm when completing an account transfer for $2,500 or more. Offer applies to new non retirement accounts funding for the first time. Credit will be deposited to your account within 30 days of receipt of evidence of charge.

TradeKing offers $4.95 trades with no minimum balance requirement or inactivity fees. I’ve been using them for a while, they are a good basic broker for ETFs and dollar-cost-averaging. For more information, please check out my TradeKing Review. One recent development is that they now require a 5 business day hold on incoming ACH bank transfers before you can trade, if the transferred amount is greater than your existing balance. If you have a $5,000 balance and transfer in $1,000 then there is no hold.

Alternatively, it’s more hassle but if you only want to open up with only $1,000, you can also get a $50 opening bonus with a a referral from an existing member with their Refer-a-Friend promotion. The referrer gets $50 as well. I have an account and if you’d like a referral, please contact me.

If someone you refer funds a new account with at least $1,000 and executes a trade, we’ll deposit $50 into both of your accounts.

Immediate Annuity Options & Trade-Offs

These days, everyone has a regained respect for stock market volatility. One way to maintain a more stable income in retirement is to take part of your nest egg and buy a single-premium immediate annuity (SPIA). With an SPIA, you pay a lump-sum upfront to an insurance company in exchange for a guaranteed stream of income payments for life. You’ll usually get a much higher income than from bonds or dividend-paying stocks. However, once you die, the payments stop and your upfront payment is gone.

How much income can you get?

The two main factors that affect your actual payout are your age and the current interest rate environment, but there are also additional options to consider. Here are a few of the biggies:

  • Single vs. joint life. Will the payments be guaranteed for only one life, or the longer of two lives? This is a popular option for couples living together.
  • Minimum guaranteed payout period. Some folks may hate the idea of losing your entire lump-sum in the event of an early death, or want a minimum payout amount. With this option, you can guarantee that payments will be made for a specific minimum period (i.e. 5 or 10 years) no matter what.
  • Inflation-adjusted payments. With this option, your monthly payments will increase or decrease by a certain percentage each year, as pegged to inflation. This will protect you from decreased purchasing power in the future due to inflation, but will significantly decrease your initial payout.

Below, the July issue of Money magazine included a nice graphic that helps show how each affect your possible payouts based on a $250,000 investment. Data is from ImmediateAnnuities.com, a handy site to get free quotes.

Buffett On Municipal Bond Risks

After being asked (well, forced) by Congress recently to testify regarding the credit rating agencies Moody’s and Standard & Poor’s and their role in the last financial crisis, Warren Buffett was also asked what he saw the next big related risk. Buffett’s reply:

Well, the huge question … if I were running a rating agency now, how would I rate states and major municipalities? I mean, if the federal government will step in to help them, they’re triple-A. If the federal government won’t step in to help them, who knows what they are? If you are looking now at something where you could look back later on and say, these ratings were crazy, that would be the area.

“I don’t think Moody’s or Standard & Poor’s or I can come up with anything terribly insightful about the question of state and municipal finance five or 10 years from now except for the fact there will be a terrible problem and then the question becomes will the federal government [help]

It’s no question that many states and municipalities are in big financial trouble. But their municipal bond debt still has relatively low interest rates suggesting that the risk of default is very, very small. No doubt, this is because the historical default rate of municipal bonds is also very, very small. But Buffett points out that in the past, not very many muni bonds were insured by private insurers (such as Berkshire Hathaway). In today’s environment, it is much more likely that a local government will go “oops” and let the insurers pick up the tab. If those dominoes start falling, then a federal bailout will be needed. Then what?

As usual, Buffett summarizes the situation nicely:

“It would be hard in the end for the federal government to turn away a state having extreme financial difficulty when they’ve gone to General Motors and other entities and saved them,” Buffett told shareholders in Omaha, Nebraska, at Berkshire’s May 1 annual meeting. “I don’t know how you would tell a state you’re going to stiff-arm them with all the bailouts of corporations.”

When I wrote about investing in California municipal bonds in September 2009, the yield on the Vanguard California Intermediate-Term Tax-Exempt Fund (VCAIX) was 3.49% and exempt of both federal and CA state income taxes (avg maturity 7 years). Today, it is down to 3.02% with an average maturity of 6 years, indicating a lower overall fear of default.

Still, if you are in the 33% federal tax bracket and 9.55% CA bracket, that 3.49% would be the same as a taxable bond yielding 4.98%. Compare this to the Vanguard Intermediate-Term Investment-Grade Fund (VFICX) which invests in high-quality corporate bonds and only yields 3.70%. Treasuries yields are much lower. For me, the yield difference is so great that it would be hard to not at least consider it as part of my portfolio.

I agree that I can’t see how the federal government will refuse to help bail out the resident investors of states when they’ve already done so many corporate bailouts. But it’s not impossible.

Stable Value Funds – Exploring Risks and Rewards

The last time I wrote about stable value funds was in late 2008, both before the 2009 crash and a time when most of my 401k was in stocks. This time around, as I was trying to figure out how to rebalance my larger portfolio in a tax-efficient manner, I took another look at this asset class found almost exclusively in defined-contribution plans like 401ks. According to the Stable Value Investment Association (SVIA), approximately 15 to 20 percent of 401(k) assets are in stable value funds.

What are Stable Value Funds?

Generally, stable value funds are a bunch of bonds which have a insurance “wrapper” around them which protects it from interest rate volatility. The intended result is a product that pays the higher interest rates of intermediate-term bonds, with the liquidity and stable day-to-day price of a money market fund. Think “cash but pays higher interest”. A chart from the SVIA [pdf] illustrates:

The Attraction

Here’s my current situation. The stable value fund in my 401k has a guaranteed net interest rate in 2010 of 3.50%. The low-cost Vanguard Intermediate-Term Bond Index Fund Investor Shares (VBIIX) currently yields 3.17%, but will have a moderate amount of price volatility, especially if interest rates rise. The Vanguard Prime Money Market Fund (VMMXX) currently yields 0.11% with its high-quality, ultra-short-term holdings and Vanguard backing.

I could get the stability of money market fund, with an interest rate more than 3% higher! (All yields are net of fees.)

The Risks

Higher interest rates with no price volatility? Free lunch? Not quite. First of all, any guarantee is only as good as the entity doing the guarantee. Check the safety ratings of the insurer of your fund. Mine is Transamerica Financial Life Insurance Co. (TFLIC):

Not the greatest, but not bad. In addition, there are actually several ways an insurer can get “out” of the contract. From the SVIA FAQ:

Are there instances when book value or contract value does not apply?
There are a few, limited instances when participants do not get book value from a stable value fund. These limited instances are typically contractually defined. One such instance typically not covered is security defaults or downgrades. In order to protect the integrity of the stable value fund, most contracts incorporate investment guidelines establishing minimum credit quality requirements for the underlying securities. These contracts have established mechanisms to address downgraded or defaulted securities that fall outside the contractual guidelines.

Corporate-initiated events, which are employer-driven events such as an early retirement program, layoff, or bankruptcy, are also typically not covered. Corporate-initiated events generally cause withdrawals in masse from a stable value fund. These withdrawals can negatively impact investors and plans that choose to remain in the fund.

First up, if the underlying securities turn out to be utter crap via a default or credit downgrade, then the insurance doesn’t apply? Wait, the insurer gets to choose the securities in the first place? Sometimes smells here. In fact, this happened in 2009 to the insurer State Street, although they decided to step in to make investors whole in order to preserve their reputation. Via this CBS Moneywatch article:

In December 2008 and January 2009, State Street elected to provide support – a total of $610 million – to the bond portfolio in stable value funds the company managed. State Street was not contractually obligated to do this. As the company’s 8-K filing (a report filed with the SEC to notify investors of any events that could be of importance to shareholders) stated, “liquidity and pricing issues in the fixed income markets” so affected the accounts that the wrappers “considered terminating their financial guarantees.” State Street’s action to bolster its portfolios kept the wrappers in place.

Finally, there is the “corporate-initiated event” of a huge layoff or bankruptcy. At the end of 2008, Lehman Brothers infamously went bankrupt, which left their stable value fund managed by Invesco with a negative return of 1.7 percent in December and an annual return for 2008 of 2 percent. In April 2009, a stable value fund for Chrysler employees only paid out 89 cents on the dollar, a drop of 11% due to the company’s troubles.

As you can see, there is a lot of things that can invalidate the guarantee. So, the next step is to understand the holdings, which in the event of a liquidation can help you imagine your worst-case scenario. You should be be able to see at least an overall breakdown of the assets, and a market-to-book-value ratio must be disclosed at least once a year. This will show any discrepancies between what the insurer says is worth $1 and what the market says. My TFLIC stable value fund’s market-to-book ratio was 101.30% as of March 31s, 2010 and here is their holdings summary:

Bottom Line

In good times, the stable value fund has a pretty easy job of maintaining an image of price stability and paying out the stated interest rate. However, when the poo hits the fan there are a lot of ways the insurance wrapper can be worth less than a bubble gum wrapper. The only real good news is that you are still left with some intermediate-term, investment-grade bonds. Even with the upheaval of 2009, the worst example I could find was a drop of 11%. Even Lehman Brothers investors ended up with a overall positive return for the year. These losses are not insignificant, but something the order of the drop in other similar bond funds during that time. The key is to understand the risks that you are taking, which oftentimes people don’t (including me).

As for my personal investments, after doing my bit of due diligence, I am going to put a small percentage (less than 5%) of my total assets in my stable value fund, given the limited alternatives in my 401k. I am willing to take the risk of a small loss in order to earn 3.50% for all of 2010 in this current interest rate environment.

Undo a Roth IRA Conversion For Profit – Tips & Tricks

Did you know that if you do a Traditional to Roth IRA conversion, that you can undo it? This “do-over” process is called recharacterization, and can come in very handy if the value of your investments drop significantly after your conversion since you owe income taxes based on the value of the IRA at the time of conversion. With the recent market volatility, this may apply to many investors as it did previously in 2008/2009.

Take the example below, from a 2009 CNN Money article but still applicable. Let’s say you had a Traditional IRA valued $150,000 at conversion, which later on drops to $100,000. At the end of the year, you’d have to pay taxes on $150k of income and also be stuck with the lower account value. By performing an “undo” and “redo” the conversion, you could pay income taxes on only $100,000 of income instead of $150,000 – a savings of $14,000 at the 28% tax rate. (Find your 2010 tax bracket.)

There are some ground rules, however. The IRS says you can perform a recharacterization until October 15th of the year following the year you converted. So if you converted in April 2010, you have until October 15, 2011. If you want to re-convert, you have to wait either 30 days after the recharacterization or until the tax year after the conversion year, whichever is later. Again, if you converted in April 2010, you’d have to wait until January 1st, 2011 to reconvert. If you wait too long in between, it is possible your account value might be even higher than before. Still, something I’ll be keeping an eye on.

(You must still meet the Roth conversion eligibility rules, previously based upon your modified adjusted gross income. In 2010, there are no income limits. In 2011 and beyond, there currently are no income limits either, but it is unknown if this will remain the case. Also, only for 2010 conversions are you allowed to split the income over 2011 and 2012, which can lower your overall tax bill based on tax brackets.)

More Advanced: Multiple Roth IRAs

How can you set yourself up to best take advantage of this “redo” opportunity? I recently read in a sample issue of Kiplinger’s Retirement Report that you should split your Traditional-to-Roth conversion into multiple IRAs for each asset class you own.

For example, you might split a $200,000 IRA into $100k of stocks and $100k of bonds. If the stocks go down to $80k while the bonds go up to $120k, just to a “redo” on the stock IRA and leave the bonds IRA alone. Assuming the values stay the same upon re-conversion, that would save you income taxes on $20,000 ($5,600 at a 28% tax rate) as compared to not splitting up the IRA since if you just converted it a single IRA, the total value remained $200,000 ($80k+$120k). Tricky!

Is Generic Financial Advice Helpful or Hurtful?

Good financial advice is hard to come by. There are so many variables, such that you have to find the balance between providing enough information, and making things digestible enough that peoples’ eyes don’t glaze over.

Check out this advice column found in the newsletter that comes in my 401k statement each month. Can you spot what’s missing?

There is no mention of what investment vehicle you should be sticking your money in, or even how much they estimate your future returns to be. Is it 100% stocks? 50% stocks/50% bonds? Orange juice futures? 6% returns? 12% returns? Who knows. Is this pre-tax or post-tax? Is it all in tax-sheltered accounts? Is my annual income supposed to rise as sharply as the chart seems to imply? I selfishly hope so!

Yet, I feel like this is what a large percentage of workers want to read. One impossibly simple chart that defines your retirement needs. So someone gives it to them. Maybe it gives them a general idea of where to start. But is a vague, possibly wrong answer better than guessing? I feel another poll coming on…

Is Such "One-Size-Fits-All" Financial Advice Helpful?

View Results

Loading ... Loading ...

Fun With Charts: P/E Ratios vs. Future 10-Year Returns

Here are another set of charts comparing the P/E10 Ratios for the S&P 500 and subsequent 10-year annualized real returns, courtesy of Mebane Faber based on Professor Shiller’s data. Can we really decide if the market is “overvalued” or “undervalued” by looking at one single number?

As noted in my earlier post about P/E ratios as a long-term predictive tool, the “P/E10 ratio” is the market’s current share price divided by average earnings over the last 10 years. By taking a long-term average as opposed to the more common single past year’s earnings, the idea is to smooth out the noise and bumps. The initial use of this ratio has been credited to famous value investor Benjamin Graham.

In the first chart above, you can see what appears to be a very strong relationship between lower P/E10 ratios and future 10-year returns. Everything is neat and tidy. High P/E10 = Bad. Low P/E10 = Good. The approximate current price of the S&P 500 is noted by the highlighted grouping. This would suggest that the median expected annualized real return for the market over the next decade would be about 5%.

In this next chart, Faber splits the data up into deciles instead. He notes a more precise trend of “great returns up to about 13, then decent returns up to about 20, then crappy returns over 20.” I personally just see a less convincing relationship. If there is such a strong correlation between lower ratios and higher returns, why should the fifth decile with P/E10 of 13 to 15 perform worse than P/E10s of 15 to 19? Hmm.

Finally, we have the actual data points. We see that although there is a nice trendline that can be created from such scattered data points, for any given P/E10 ratio there is a very wide variety of returns. Accordingly, in my humble opinion, I would be careful not to make P/E10 your main basis for setting asset allocations. It’s a nice idea that scores well in the common sense category, but in reality has been far from perfect.

Net Worth & Goals Update – July 2010

Net Worth Chart 2010

Time for another net worth update… last one was back in April.

Credit Card Debt
I used to take money from credit cards at 0% APR and place it into online savings accounts, bank CDs, or savings bonds that earned 4-5% interest (much less recently), keeping the difference as profit while taking minimal risk. (Minimal in regards that the risk was under my control.) However, given the current lack of great no fee 0% APR balance transfer offers, I am currently not playing this “game”.

Most credit cards don’t require you to pay the charges built up during a monthly cycle until after a grace period of about 14 days. This theoretically provides enough time for you to receive your statement in the mail and send back a check. As this is simply a real-time snapshot of my finances, my credit card debt consists of just these charges.

Retirement and Brokerage accounts
We recently converted our Traditional IRA balances to Roth IRAs, as the income restrictions were lifted this year. The choice to convert was rather simple for us, as we had non-deductible contributions that will now be able to be withdrawn tax-free. (We still owe taxes on very modest gains.)

Our total retirement portfolio is now $289,277 or on an estimated after-tax basis, $249,976. At a theoretical 4% withdrawal rate, this would provide $833 per month in after-tax retirement income, which brings me to 33% of my long-term goal of generating $2,500 per month.

Cash Savings and Emergency Funds
We are now a bit below a year’s worth of expenses (conservatively estimated at $60,000) in our emergency fund. This is after withholding some money for paying taxes on the Roth IRA conversion above, and also for undisclosed, one-time recent expenses. It’d be fun to say that we picked up a convertible or something, but the reality is much less exciting. 😛

Our cash savings is mostly kept in a combination of a rewards checking account (with debit card usage requirements), a SmartyPig account at 2.15% APY currently, or in a 5-year CD from Ally Bank, which despite the long term still provides a very competitive yield even if you withdraw early before the 5 years is up. (See here for more details.)

Home Value
I am still not using any internet home valuation tools to track home value. After using them for a year and finding them unreliable, I am back to maintaining a conservative estimate and focusing on mortgage payoff. If we get some positive cashflow after retirement savings, I do want to pay it down faster.

Lessons From a Stock Newsletter Scandal

I ran across another cautionary tale highlighting the world of paid stock newsletters, where people pay hundreds of dollars for “exclusive” stock picks.

In this one, former professional baseball player Lenny Dykstra somehow become a highly-touted investment columnist in 2005 for TheStreet.com. Here’s a video of Jim Cramer heaping praise upon Dykstra, calling him “one of the great ones” and one of the 5 people in the world he’d take stock advice from.

Dykstra specialized in deep-in-the-money calls, and promised a 95% success rate. He sold over a million dollars in newsletter subscription fees at TheStreet.com. Then things started falling apart.

Sharp bloggers exposed this scam: he counted his winners, but endlessly rolled over his losers, so that he could keep claiming no losses. He didn’t even make the picks himself; they were supplied by another stock analyst. His actual return on money was probably negative. Dykstra was fired in April 2009 and is now in bankruptcy.

The most recent allegation is that Dykstra secretly took $250,000 in exchange for recommending a little-known stock to his newsletter subscribers and “access” to Jim Cramer, according to sources within the company.

As you can see, stock newsletters can be very murky. How can you verify their advertised performance is true? Are they being paid to tout the stocks you’re reading about? Mutual funds are highly regulated. Stock newsletters are not.

Most stock newsletters are more about marketing than actual results. For example, did Cramer really think Dykstra was a genius? Or did he simply see the opportunity to leverage an athlete’s well-known name to create a lot of easy buzz and thus money?