VEIEX Fund vs. VWO ETF Performance Comparison

The bottom line for converting to the ETF version of equivalent mutual funds: lower costs = greater returns = more money. To illustrate this, I ran over to Mornginstar.com and compared the 5-year returns for VEIEX and VWO, the mutual fund and ETF versions of the Vanguard Emerging Markets Index Fund, respectively. Here’s the growth chart of $10,000 invested from 6/24/2005 to 6/24/2010 (click to enlarge):

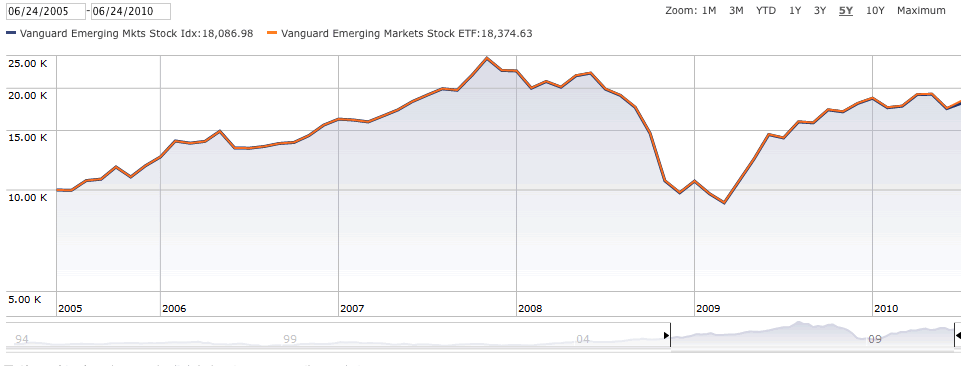
Looks pretty much the same, right? That’s because they hold the same stocks inside, but VWO has a lower cost through its lower annual expense ratio. That initial $10,000 would have ended up as $18,086.98 invested in VEIEX, while it would have become $18,374.63 invested in VWO – a difference of $287.65. Not a huge difference, but significant in my book, considering it required no increase in risk.

This comparison also doesn’t take into the additional 0.5% purchase fees and 0.25% redemption fees charged by VEIEX when buying and selling shares, although the hit does become less significant as your holding period lengthens.

Vanguard Mutual Fund to ETF Share Conversions

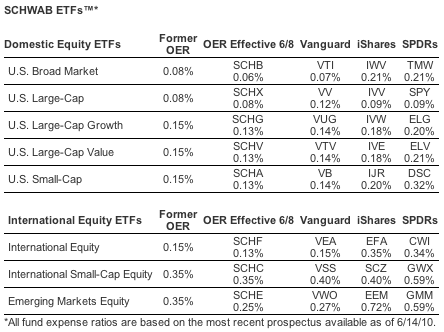
If you are invested in Vanguard mutual funds, you might have been confused by their recent announcement of free trades for Vanguard ETFs for in-house brokerage customers. One consequence of this is that it makes it more attractive for many folks to convert their existing mutual funds to their respective ETF versions. Here’s what the Vanguard website has to say about it:

Can I convert conventional Vanguard mutual fund shares to Vanguard ETFs?

Shareholders of Vanguard stock index funds that offer Vanguard ETFs may convert their conventional shares to Vanguard ETFs of the same fund. This conversion is generally tax-free, although some brokerage firms may be unable to convert fractional shares, which could result in a modest taxable gain. (Four of our bond ETFs—Total Bond Market, Short-Term Bond, Intermediate-Term Bond, and Long-Term Bond—do not allow the conversion of bond index fund shares to bond ETF shares of the same fund; the other eight Vanguard bond ETFs allow conversions.)

There is no fee for Vanguard Brokerage clients to convert conventional shares to Vanguard ETFs of the same fund. Other brokerage providers may charge a fee for this service. For more information, contact your brokerage firm, or call 866-499-8473.

Once you convert from conventional shares to Vanguard ETFs, you cannot convert back to conventional shares. Also, conventional shares held through a 401(k) account cannot be converted to Vanguard ETFs.

In my opinion, the main question to ask is if you wish to buy ETFs from now on. See the Vanguard ETF vs. Mutual Fund decision process. If so, then it’s probably a good idea to convert your existing mutual funds to ETFs as well, since there is no effect tax-wise.

However, technically you could just convert your mutual funds to ETFs for the annual expense ratio savings, and then continue on buying mutual funds. Depending on the fund, the annual savings could be significant. You’ll still avoid any redemption fees, like the 0.25% that the Vanguard Emerging Markets Index Fund (VEIEX) charges. Perhaps you really like dollar-cost-averaging a fixed amount in regular intervals ($100 every two weeks, etc.).

How To Do The Conversion at Vanguard

  1. You’ll have to open a brokerage account with Vanguard, which is relatively straightforward. In the application, you’ll have to answer some employment questions and disclose any stock exchange affiliations. You’ll also choose a money market fund for your cash sweep account. See my Vanguard Brokerage opening process review for more details.
  2. Next, you should log into your mutual fund account and record the cost basis for your mutual fund shares for tax purposes. Look for the blue “Cost Basis” link when looking at your portfolio holdings. Print that page out for your records, so you know what you paid for your current holdings.
  3. Finally, you must call Vanguard and request the ETF conversion. (You can’t do it online.) The conversion will be done according to the net asset value (NAV) of the funds on the next available market close at 4pm Eastern. Approximately two days later, the new ETF shares should show up in your brokerage account. You will end up with partial shares, which can only be liquidated if you sell your entire position. It’s okay though, they still earn dividends and all that good stuff.

Vanguard Mutual Funds vs. ETFs: The Decision Process

You want index funds. You want Vanguard. Should you buy them in mutual fund form, or ETF form?

There are several pages on the Vanguard website dedicated to help you learn the differences between their ETFs and mutual funds. Check out their ETF basics page and their ETF vs. mutual funds page. There is a nice little video if you visit this page and look for this image:

Briefly, Vanguard mutual funds have different share classes. For their popular index funds, there is usually an Investor class of mutual fund, an ETF class, and an Admiral class for $100k+ balances. For example, for the Vanguard Total Stock Market funds, you have VTSMX (investor), VTSAX (admiral), and VTI (ETF). Each share class still holds the same basket of stocks. How they differ is primarily in trading structure, and both transaction and ongoing costs.

Reasons to Switch to ETFs

  • ETFs generally have lower expense ratios. This mean each year, all else equal, your net returns will be higher with the ETF than with the mutual fund. Over a long period of time, this savings can be substantial.
  • Greater trading flexibility. ETFs trade on an exchange alongside individual stocks, which means continuous intra-day pricing, and the ability to use advanced orders like limit or stop orders. (If you really want, you can even buy them on margin and/or short sell them.) Mutual funds are only traded at one price a day, and only with market orders.
  • No short-term redemption or other sell fees. This only applies to certain mutual funds.

Why You Should Stick With Mutual Funds

  • No automatic, dollar-based trading. If you like to dollar-cost-average, for example by automatically investing a regular amount of $100 every two weeks, then you would have to stick with a mutual fund.
  • Smaller balances. You need a $3,000 minimum to open a Vanguard Brokerage account. Also, if you have only say $2,000 in an IRA, you will be left with some uninvested cash because you must buy whole shares.
  • Bid/ask spread. This is a small transaction cost that represents the difference the offer and the sale price on an exchange, and ends up being profit for the market-maker. Vanguard provides estimates for the effect of this spread in their ETF calculator (see below).
  • Commission costs. This is not a concern in a Vanguard Brokerage account as they allow Vanguard ETFs to be traded commission-free, but in other brokerages they will charge their standard commission fees.
  • NAV premium/discounts. An ETF is allowed to trade above or below the actual value of the assets taken separately (NAV, or net asset value). Usually market forces and arbitrageurs keep such deviations from being large, and if you buy regular amounts it should even out over time, but at times the premiums can be significant. Some investors don’t like this uncertainty, and prefer the knowledge that they every purchase exactly at NAV.

Vanguard even created a nice mutual fund vs. ETF cost comparison calculator where you can punch in your number and see the long-term expected savings of buying ETFs. It takes into account bid/ask spreads, commission costs, future purchases, and more.

Total Stock Returns = Fundamental + Speculative Returns

Another theory of predicting future stock market returns states that there are three main components to long-term stock market performance. Amongst many others, I learned this from authors and investors Jack Bogle and William Bernstein.

Part 1: Dividend Yield
If your stock distributes 2% in dividends each year, then you will have a 2% contribution towards of return. This is what dividend investors love to see coming in each quarter, and is relatively easy to track for a large group of companies. Here it is over time for the S&P 500, courtesy of Multpl.com:

Part 2: Earnings Growth
If earnings stay constant, then all other things equal, one would expect the share price of your company to stay constant as well. If the earnings grow by 5% every year, then your share price will grow by 5% per year. Thus, earnings growth rate is a vital component of total return.

If your portfolio was all of the stocks traded in the United States, like that of a broad-based index fund, this would create a connection between the growth rate of the nation’s Gross Domestic Product and the earnings growth rates of all US companies. In other words, the fundamental return is based on GDP growth. In turn, the GDP growth rate is connected to population growth and productivity per person.

These two parts added to together are coined the fundamental return:

Fundamental Return = Earnings Growth + Dividend Yield

Some bad news: Now, from 1950-2000, fundamental returns were 10%: 4% dividend yield and a 6% earnings growth rate. These days, the S&P 500 has a dividend yield of only about 2%. Earnings growth rate estimates are subject to debate, but they hover around 5-6%.

Part 3: Changes in P/E Ratio
The price-to-earnings (P/E) ratio is the price per share divided by earnings per share. In other words, it is how much investors are willing to pay for each unit of earnings. If they are willing to pay 20 times annual earnings, the share price of the stock will be twice as high as if they only paid 10 times earnings. This part is denoted the speculative return, as it has changed throughout history. Here it is again for the S&P 500:

In 1950, the P/E ratio was less than 10. As of right now in mid-2010, it is 20. It is very unlikely that this more than doubling of price-per-share will happen again, with the historical average being around 15. (During the dot-com bubble, the P/E ratio was over 40. In 2008, it was over 25.) This will lead to a zero, and quite possible negative, future speculative return!

Summary

When predicting future returns, you have to look at all the sources of those expected returns. Fundamental return is still a solid reason why stock prices will go up on the long-term, especially if you are not investing only in one country or economy. Some people call it a belief in capitalism, that economic growth will continue and GDP will continue to increase. I simply believe in the passion and motivation of all the people out there, from Sweden to China to Brazil. However, there is good evidence that you might not be getting 10% historical returns due to P/E ratio contraction.

In a recent column, Larry Swedroe shares that the forecasts that he has read are predicting a 5% total annual growth in earnings and 2% dividends for a total return of 7% (similar to above). Inflation is predicted at 2.5%. However, he points out the current minimal-risk return is pretty low as well, so you need consider the big picture:

The bottom line is that while the expected nominal return to stocks is lower than the historical return, so is the expected return to Treasury bonds. You should decide if the expected risk premium for stocks is sufficient given your unique ability, willingness and need to take risk.

Grantham/GMO 7-Year Asset Class Forecast

Jeremy Grantham is the head of GMO, an institutional asset management company that has more than $100 billion dollars under management. According to Wikipedia, he started one of the first index funds? He’s built a reputation as a market genius, with stories of successfully avoiding the Japanese bubble, the Dot-com bubble, and the most recent Credit Crisis. Of course, sometimes he was very early and people lost a lot of money trying to follow him.

Every quarter, GMO releases a 7-Year Asset Class Forecast. You can read it and other market commentary for free by registering on their website. I wouldn’t call looking ahead 7 years a “long” time horizon, but since I’ve exploring future market returns, I figured why not throw it out there for future reference. Here’s the latest forecast as of April 30th, 2010. (Click to enlarge.)

The chart represents real return forecast for several asset classes and an estimate of net value expected to be added from active management. These forecasts are forward-looking statements based upon the reasonable beliefs of GMO and are not a guarantee of future performance. Actual results may differ materially from the forecasts above.

GMO expects the High Quality US stock, Emerging Markets stock, and Managed Timber asset classes to have the highest real return over the next 7 years. I pretty much ignore the value-added part (“alpha”) because even if I believed it, GMO won’t manage my money for me anyway. 😛

Portfolio Solutions 30-Year Stock/Bond Market Forecast

Every year, the low-fee investment advisor Portfolio Solutions, LLC founded by Rick Ferri provides a 30-year market forecast based on their analysis of several factors. In their own words:

Each year, we analyzed the primary drivers of asset class long-term returns including risk as measured by implied volatility, expected earnings growth based on expected long-term GDP, market implied inflation based on the spread between long-term Treasury Bonds and TIPS, and current cash payouts from interest and dividends on bond and stock indexes. These factors plus others are used in a valuation model to create an estimate for risk premiums over the next 30 years. In a sense, we believe these expected returns reflect what the market is estimating will be a fair payment for each asset class over T-bills over the long-term.

You can view all the asset classes on their site, but I have included some of the major ones below for preservation and reference. Another set of estimates to throw into the mix.

Thirty-Year Return Estimates, Assuming 3% Inflation

Asset Classes

Real Return

With 3% Inflation

Risk*

Government-Backed Fixed Income

Intermediate-term U.S. Treasury notes

1.5

4.5

5.0

Long-term U.S. Treasury bonds

2.0

5.0

5.5

Corporate and Emerging Market Fixed Income

Intermediate-term high-grade corporate (AAA-BBB)

2.3

5.3

5.5

Foreign government bonds (unhedged)

2.5

5.5

7.0

U.S. Common Equity and REITs

U.S. large-cap stocks

5.0

8.0

15.0

U.S. small-cap stocks

6.0

9.0

20.0

REITs (real estate investment trusts)

5.0

8.0

15.0

International Equity (unhedged)

Developed countries

5.0

8.0

17.0

Developed countries small company

6.0

9.0

22.0

All emerging markets including frontier countries

8.0

11.0

27.0

*The estimate of risk is the estimated standard deviation of annual returns.

Schwab Reduces Expense Ratios on Selected ETFs

Discount stock broker Charles Schwab cut the fees on six of its proprietary exchange traded funds (ETFs) on Monday (official press release).

  • Schwab U.S. Broad Market ETFTM from 0.08% to 0.06%
  • Schwab U.S. Large-Cap Growth ETFTM from 0.15% to 0.13%
  • Schwab U.S. Large-Cap Value ETFTM from 0.15% to 0.13%
  • Schwab U.S. Small-Cap ETFTM from 0.15% to 0.13%
  • Schwab International Equity ETFTM from 0.15% to 0.13%
  • Schwab Emerging Markets Equity ETFTM from 0.35% to 0.25%

The press release also contained a comparison of expense ratios for several similar ETFs from different providers. Price war!

For practical purposes, you would often have to have sizable balances before moving ETFs just because of the slight differences in many of these ETFs. Every 0.01% difference means $1 a year for every $10,000 invested (yup, one dollar). Every bit helps, but consider things like tax consequences and trade commissions first.

But this is still good news for me, as my 401(k) administrator recently approved the addition of a self-directed brokerage option available only through Charles Schwab. They also said they plan to start a TIPS and two regular Treasury ETFs this summer. There are no trade commissions charged on Schwab-branded ETFs when traded inside a Schwab account (see previous post with outdated expense ratios).

Commission-free online trading of Schwab ETFs is available to individual investors at Schwab, to the more than 6,000 independent investment advisor firms who use Schwab’s custodial services through Schwab Advisor Services and through Schwab retirement accounts that permit trading of ETFs.

Fidelity Investments offers free trades on iShares ETFs and Vanguard offers free trades on their own Vanguard ETFs.

Firstrade Brokerage Switches Clearing Firms, Offers Free Outgoing Account Transfers

I received a letter this week that discount stock broker Firstrade is changing clearing firms from Ridge Clearing to Penson Financial*. Not really a big deal, but hidden in the fine print is that existing users can perform an account transfer to another broker with no fee if you request a transfer within 30 days from the Conversion Date (“on or about June 25, 2010”). The normal outgoing ACAT transfer fee is $50, so this gives you an opportunity to consolidate or switch brokers with no cost.

If you are looking to open a new account with Firstrade, they do offer an fee rebate against your old broker for transferring over. In addition, they have a Firstrade Refer-a-Friend program that offers new customers 5 free trades to start.

* Penson Financial is used by several other discount brokers, including low-price leaders Zecco and OptionsHouse.

Future Stock Market Returns: Price-Earnings Ratios as a Long-Term Predictive Tool

As part of gathering the data needed to go beyond net worth, I’ve shown ways to track find your personal savings rate by tracking your current spending with your current after-tax income. For now, I’m skipping ahead to estimating your portfolio’s long-term investment returns.

There are a lot of ways to estimate future stock returns. You’ve probably heard of the P/E ratio, which is usually the price divided by last year’s earnings. This is one measure of “value”. Here is a plot of historical values of the inflation-adjusted S&P 500 index, along with its annual earnings (source).

Historical Price & Earnings Separately
Historical P/E Ratio

As you can see, there is a lot of volatility in P/E ratio. The “P/E 10” ratio is the share price divided by the average earnings over the last 10 years. By taking a long-term average, you smooth out the noise and bumps.

Professor Robert Shiller of Yale University, which provided the above data as well, spoke about the usefulness of this ratio in his book Irrational Exuberance, and provided the data for the following chart. The x-axis shows the real “P/E 10” of the S&P Composite Stock Price Index (inflation adjusted price divided by the prior 10-year mean of inflation-adjusted earnings). The y-axis shows the geometric average real annual return of the same index, reinvesting dividends, and selling 20 years later.

Price-Earnings Ratios as a Predictor of Twenty-Year Returns

You can definitely see the relationship that a higher P/E10 usually leads to a lower future return. However, there is still a great deal of scatter for any given P/E10 ratio.

What about today? As of June 2, 2010 the P/E10 is 19.99 with the S&P 500 index at around 1,098. Historical average is about 15. Back in March 2009 when everything was looking bleak, the P/E10 was 13.32. (P/E10 is also referred to as Cyclically Adjusted Price Earnings (CAPE) ratio.)

The Early Retirement Planning Insights website provides a calculator that forecasts future returns based on the current value of P/E 10, again using historical returns. I’m not sure exactly how they did all the regression. Here’s their return forecast for a P/E 10 ratio of 20.

Future Returns Prediction (P/E10 = 20)

For a 20-year forecast, it shows an average outlook of 4% returns, on a real (after-inflation) basis. Of course, the range indicates that the actual returns could look much worse. As the time-horizon lengthens, the range gets smaller due to the phenomenon of reversion to the mean. Kind of scary to look 60 years ahead!

Warnings

To me, this stuff is useful as a general Big Picture planning tool, not as a short-term trading tool. These are just predictions based on the past, which is often the best we can do, but still far from perfect. Many people use P/E10 as a tool for market timing, shifting their asset allocation as it rises and falls. Shiller himself states that his plot above:

confirms that long-term investors—investors who commit their money to an investment for ten full years—did do well when prices were low relative to earnings at the beginning of the ten years. Long-term investors would be well advised, individually, to lower their exposure to the stock market when it is high, as it has been recently, and get into the market when it is low.

That may be true, but market timing systems can really test an investor’s faith when they seem to be wrong for a long period of time. On a personal basis, I’d probably limit any asset allocation moves – if any – to if the P/E10 ratio moved to an extreme, for example dropped below 10 or above 25.

Betterment.com Review: Investing Made Simple, But Is It Worth The Cost?

New start-up website Betterment.com wants to make investing more easy… imagine something as simple as your existing savings account but with higher returns. Too good to be true?

How does it work?

At it’s very core, Betterment is a standard brokerage account, like E*Trade or Scottrade, which holds stocks and bonds in the form of exchange-traded funds (ETFs). On top of this, Betterment provides a lot of automation and simplification so that a user’s required day-to-day involvement is minimized.

Using a short questionnaire or a simple slider bar, you can choose a basic asset allocation (AA) of, say, 80% stocks and 20% bonds. After that, you just link a checking account and transfer money in and out as you please. When you move money into Betterment, they’ll buy ETFs automatically for you according to your chose asset allocation. If you want to withdraw, they’ll make the needed sell trades for you. Dividends are reinvested automatically, and your portfolio is rebalanced quarterly if off by more than 5%.

Asset Allocation Tools

For me, the part I played with the most was the interactive demo that illustrated potential returns based on past results. The dark blue line shows the historical average, dark blue bands indicate where 80% of outcomes have fallen, and the light blue bands show where 95% of outcomes have fallen. Here are some screenshots for a $50,000 portfolio of 85% stocks/15% bonds over 1 year and 10 years (click to enlarge).

(Past performance does not guarantee future results…)

Replace your savings account?

Betterment.com has been getting some heat – in my opinion rightfully so – for some of it’s marketing slogans as a “savings account replacement” or “better than a bank”. This is not a bank. You are buying stocks and bonds. You can lose a lot of money. Even their most conservative option of inflation-linked bonds can lose money in the short-term due to interest rate fluctuations. Yes, they admit this all somewhere, but it should be clearer. You just can’t compare yourself even indirectly with a savings account when the risk levels are so different.

Another example is this quote in their “Safe and Secure” section on the front page:

We are a member of the Securities Investor Protection Corporation (SIPC), which means the securities in your account are protected up to $500,000.

SIPC-insured is not the same as FDIC-insured. SIPC only covers restoring assets to investors if your firm goes bankrupt. It does not insure the value of those assets. It does not cover investment fraud. Will people get confused? I think there is a good likelihood that some will.

Portfolio

So what are you actually buying? For the stock portion of your account, you are buying a basket of ETFs broken down as follows:

  • 10% SPDR Dow Jones Industrial Average ETF
  • 20% iShares S&P 500 Value Index ETF
  • 20% iShares S&P 1000 Value Index ETF
  • 15% iShares Russell 2000 Value Index ETF
  • 15% iShares Russell Midcap Value Index ETF
  • 20% Vanguard Total Stock Market ETF

In my opinion, there is a lot of unnecessary overlap here. Of course, they’re paying for the trades, so maybe that in itself doesn’t matter that much. But more importantly, where’s the international exposure? I’d rather be invested in something as simple as 50% Vanguard Total Stock Market (VTI) and 50% Vanguard FTSE All-World ex-US ETF (VEU). You’d own fewer ETFs but more different companies and be globally diversified.

As for the bond portion, that’s 100% Treasury Inflation-Protected bonds via the iShares Barclays TIPS Bond ETF (TIP). Here, I’d rather see a 50% split between TIP and some nominal Treasuries bonds like IEF or SHY. (As recommended by David Swensen.) More diversification, same high credit quality.

Fees

There are currently no minimum balances required to invest. You don’t pay commissions per trade, but instead are charged a flat 0.9% annual management fee on top of the ETF management fees of about 0.20%. Just for their fees, that’s $45 a year on a $5,000 account, and $450 a year on a $50,000 account. So what you have here is a really simple wrap account. (Compare with Fidelity Portfolio Advisory Services.) In exchange, you get a lot of automation. No manually placing trades or remembering to rebalance.

If you have a low-balance account, this works out to be a pretty good deal *if* you like their portfolio above. Even a discount brokerages range from $7/trade at Scottrade to $3.95/trade at OptionsHouse. If you have only a couple thousand dollars to invest, Betterment can be very economical. (Though I suspect that they will have to change their pricing structure at some point for small accounts that trade a lot.) If you have $25,000 or more in assets, you can do much better on your own, and it’s more likely to be worth your time to expand your investment mix.

Reinventing the wheel?

Time to compare this with existing alternatives. You can already buy a nice all-in-one mutual fund from Vanguard like the Vanguard 2045 Target Retirement Fund (VTIVX) with a $3,000 now $1,000 minimum investment. In a similar manner, you can choose your general asset allocation and they’ll maintain and rebalance for you as well, gradually becoming more conservative as time goes on. International stock exposure including emerging markets is included. They’ll let you transfer funds to/from a bank account in $100 increments. Those trades are also free when you hold them at Vanguard.com, and all this costs just 0.20% annually including all fees. Compare this to 1.1% in total expenses you’ll pay at Betterment.

Finally, a quick note about tax efficient placement of assets. When possible, it’s usually better to place less tax-efficient assets like bonds into tax-sheltered accounts like IRAs and 401k plans. You can’t do this easily with such all-in-one systems.

Tracking Inflation: Consumer Price Index Explained – Infographic

The U.S. government tracks inflation in many ways, and one popular way is the Consumer Price Index (CPI). This index is then used to adjust everything from income tax brackets to Roth IRA contributions limits to pension payouts to the return on inflation-linked bonds (TIPS). There are then sub-indices for different groups and regions.

Each month, the Bureau of Labor Statistics gathers 84,000 prices in about 200 categories — like gasoline, bananas, dresses and garbage collection — to form the Consumer Price Index, one measure of inflation. […] The categories are weighted according to an estimate of what the average American spends, as shown below.

The NY Times put together a nice interactive infographic that helps explain the ingredients of the CPI and their relative importance:

You can hover your mouse, and zoom in/out as you like. Does it match your personal spending and inflation rates? Probably not, so it’s good to note the differences. For instance, actual housing prices are not included in the CPI, but instead “owner’s equivalent rent” (24% of CPI) is tracked which is defined as what homeowner’s would pay to rent their home. And once I get my mortgage paid off, I’ll be more worried about other things like health insurance (only 6% of CPI).

Link via the Betterment Blog (Betterment review upcoming).

Vanguard Brokerage Services: Funds Availability Policy For Trading

Now that I’m probably going to set up Vanguard Brokerage Services (VBS) with a taxable account, I did an online chat to figure out their funds availability rules for buying and selling stocks. The main reason is that their money market funds don’t yield very much right now (0.04% for Prime Money Market), so I want to keep my cash elsewhere.

Bank Transfers, Trade Dates, and Settlement Dates
According to their bank transfer policy, transfers from a bank to a money market fund submitted before 10 p.m., Eastern time, on a Vanguard business day will receive the next business day’s trade date. Purchases submitted “after 10 p.m., Eastern time, or on weekends or holidays will receive a trade date of the second business day after your submission.”

Your bank account will be debited on the business day following your trade date (typically two business days after you enter your purchase request). For most mutual funds, the settlement date is one business day after the trade date. This is known as “T+1”.

Stock Settlement Timing, T+3
When you buy a stock, the settlement date is three business days after the trade date. This is known as “T+3”. According to the SEC, this rule means that when you buy securities, the brokerage firm must receive your payment no later than three business days after the trade is executed.

What Does This Mean?
Let’s say I get the urge to buy some shares of VWO while the market is still open, call it Day 1. But my sweep money market is empty. I can actually place a buy order for VWO as long as I place a bank transfer on Day 1 as well, and I already have other assets at Vanguard. (There may be a warning message, but you can override it.) Theoretically, my trade date will be Day 2 and my bank account will be debited on Day 3. Therefore, the money will be ready by the due date of Day 4.

This is nice, because it means I don’t have to keep any cash in the sweep account until I wish to make a purchase (as long as it’s not larger than my existing assets).

Warnings
However, you should be sure that you have money in the bank, because if the bank transfer does not go through, Vanguard has the right to sell your other assets (mutual funds, etc.) to fill that VWO order. They won’t just cancel it, because otherwise this would be an easy way to cheat the market if the stock price dropped in the meantime. The Vanguard Rep said that they would call you in this case, probably to either get you to wire money over or have you choose what assets to be liquidated.

Another option would be to enable margin on your accounts, which lets you borrow money against your other assets and pay interest. You can then use that borrowed money to buy stocks. Sometimes paying a few days of interest is worth the flexibility.