If you’re interested in what Warren Buffett and Charlie Munger said in their famous Question & Answer session of the 2009 Berkshire Hathaway Annual Meeting, the best raw source I found was this page of the Omaha World-Herald. It’s written in a “live blog” format, which seems to cover all the major questions in easy-to-read bites with adding too much extra opinion or analysis.
Access Morningstar X-Ray, Portfolio Management Tools For Free
Posted on May 4, 2009 // 6 Comments
![]() Morningstar.com has a bunch of helpful tools for managing your investment portfolio. Many of them are free, but some require you to be a member. Premium membership is not cheap at $174 a year ($115 with Fidelity account), although you do get other features like mutual fund analyst reports. But since I’m not interested in those, I was happy to discover that most of the free tools and even some of the normally paid tools are available to all at T. Rowe Price. You don’t even need an account with them. Both sites require free registration (basically just e-mail).
Morningstar.com has a bunch of helpful tools for managing your investment portfolio. Many of them are free, but some require you to be a member. Premium membership is not cheap at $174 a year ($115 with Fidelity account), although you do get other features like mutual fund analyst reports. But since I’m not interested in those, I was happy to discover that most of the free tools and even some of the normally paid tools are available to all at T. Rowe Price. You don’t even need an account with them. Both sites require free registration (basically just e-mail).
Here is a roundup of the tools that are available, along with links to both sites where available. Since many of the tools are integrated, I have found it easier just to keep all my data at T. Rowe Price.
Portfolio Manager (TRP / Morningstar)
Portfolio Manager “enables you to track, rebalance, and analyze your portfolio. It includes a complete picture of all your holdings’ prices and performance – individual securities and funds together – in a convenient one-page format that’s updated throughout the trading day.” You can either track all your transactions as you go, or just input your current holdings. The Morningstar version differs by appearing to be slightly newer, and allows you to import your portfolio from an external Quicken/Money/Broker .csv file.
Portfolio X-Ray and Portfolio Instant X-Ray (TRP / Morningstar)
The Morningstar Portfolio X-Ray tool is a great tool that lets your look “under the hood” of your mutual funds. Does your “small cap” fund really own a bunch of mid-caps and large-cap funds? X-Ray will reveal your true exposure to stock style (i.e. Small/Mid/Large, Growth/Blend/Value), geographical regions (i.e. Japan, US) , stock sectors (i.e. Telecom, Energy), and individual equities (i.e. type, Top 10 holdings).
Also, by looking at your portfolio as a whole, you can see your true asset allocation. Maybe some of your funds have overlap that you didn’t know about. The “Instant” version, which the only version available for free at Morningstar, does not allow you to save your portfolio X-rays for future sessions.
Asset Allocator (TRP / Morningstar Premium Only)
Asset Allocator “is a quick, simple calculator that shows the probability of achieving an investment goal based on current portfolio value, investment mix, and savings rate.” Fun to play with for a while, but if you aren’t savvy it can create the illusion that the answer to reaching your goals is simply to increase your stock percentage until you get the return you want. Use with caution.
Portfolio Watchlist (TRP / Morningstar)
Portfolio Watchlist “helps you track your investments against pricing and volume targets in a convenient one-page format that’s updated throughout the trading day.” Basically the same as Portfolio Manager above, but you can track a bunch of different model portfolios. This is great for creating a benchmark for your performance, or seeing what would happen if you tweaked something.
IRA Calculator (TRP / Morningstar)
A somewhat basic tool, but still handy. The IRA Calculator has three different sections: Eligibility (determine your contribution limit for a Roth or Traditional IRA), Comparison (compare various scenarios to find out which type of IRA works best for you), and Conversion (find out whether it makes sense to convert a Traditional IRA to a Roth IRA).
Should I Buy Gold Now To Hedge Against Future Inflation?
Posted on April 27, 2009 // 24 Comments
Due to the current market conditions, many investors are wondering if investments in gold should be added to their portfolios to hedge against future inflation risks. In the video below (direct link), author Larry Swedroe discusses why he thinks gold is not an appropriate hedge against inflation, as well as some alternative investments.
The debate about gold will probably continue on for eternity, but I tend to lean towards his analysis because gold is too volatile for my tastes. I do like the idea of keeping some physical gold bullion as a hedge against economic collapse, but not as ETFs taking up a huge chunk of my portfolio. I would rather have something that would fit into traditional asset allocations plans, providing both stability and a good (but not perfect) hedge against inflation. So let’s explore the recommended alternatives:
In tax-advantaged accounts like IRAs, Swedroe instead recommends Treasury Inflation-Protected Securities (TIPS) which adjust with the Consumer Price Index (CPI). For this, I have bought shares of the Vanguard Inflation-Protected Securities Fund (VIPSX). I could buy individual funds directly from the government at no cost, but for now I like the simplicity. I even increased my allocation recently.
In taxable accounts, he recommends highly-rated municipal bonds with a relatively short average maturity of 3-5 years. For this, I am looking to buy shares of the Vanguard Limited-Term Tax-Exempt Fund (VMLTX). It is currently about 83% AA/AAA rated municipal bonds, and keeps a maturity of between 2 and 6 years (currently 2.8). The yield is currently a tax-exempt 2.12%, and it has a low expense ratio of 0.20%. If inflation does rise, the yield should rise to keep up.
I’m actually surprised he didn’t bring up commodities funds here as well, which I’ve seen him recommend as insurance against unexpected severe inflation.
Amortization Schedules and Principal Prepayment, Part 2: Verification
Posted on April 24, 2009 // 9 Comments
Yesterday in Part 1, we talked about the basics of amortization and mortgage prepayment. In this post, I just wanted to share some other interesting results I got when tinkering around with the amortization schedule.
Are you always paying the same amount of interest?
As I noted before, amortization is a way to make equal payments but still preserve the right ratio of principal paydown and interest. You can check this using the same schedule of payments as before, except now I’m just looking at it broken down by 12 years instead of 360 months. ($200k mortgage, 30-year fixed at 5%).
If you have a loan of $200k at 5% interest, simple arithmetic will lead you to guess you’ll pay around $10,000 of interest the first year. As you see above, during the first year you actually pay $9,933 towards interest, as your loan balance went from $200,000 down to $197,049 over time. If you simply divide the $9,933 by the average of $200,000 and $197,049, again you’ll get 5%.
This just provides a rough estimate, but you can see that you’re always paying 5%, even as the principal shrinks. Only at the very end does it vary slightly, not sure why exactly, but I’m guessing due to smaller numbers. The lender isn’t ripping you off by having you pay a ton of interest in the first year. You just have a lot of interest to pay! Kind of neat, actually.
Is your investment return from paying extra towards principal really the mortgage’s interest rate?
When you pay down your mortgage at 5% interest, it is often assumed that this is the same as investing that cash elsewhere and earning 5% per year. (Ignoring tax issues.) But is it?
Again, a quick check on the spreadsheet confirms this. Let’s say I am just starting Year 2. If I prepay the entire equity portion of $3,102, this will advance me to Year 3 of the schedule, and I will be shaving off one year from my mortgage. In other words, my $3,102 will be worth an entire year’s worth of payments, or $12,884, in 29 years. This works out to be the same as a 5.03% annualized return. Close enough for me. Again, if you prepay near the very end of the term, the percentage starts to drop off a bit. But remember, if you’re prepaying, you’ll probably be finished with your mortgage well before reaching that point.
I’ve plotted both the effective interest rate paid and the paydown investment return (gain) below:
You can play with the spreadsheet yourself at Google Docs or in Microsoft Excel format.
Amortization Schedules and Principal Prepayment, Part 1: Shortening a 30-Year Mortgage Into 15
Posted on April 23, 2009 // 47 Comments
I’ve been tinkering around with my mortgage. Have you ever wondered how the monthly payment was determined? It’s called amortization. An amortization schedule is a way to make equal payments over a period of time, but have the payments split between principal and interest so that the interest paid over time decreases over time along with the loan amount remaining. It is a balancing act to be fair to both borrower and lender, and you can find a mathematical derivation here.
The most direct way to see where you are on your amortization schedule is to ask your lender to send you a copy. Alternatively, you can generate one yourself by using a mortgage calculator with this feature. Here is the amortization schedule for a $200,000 loan with a fixed interest rate of 5% over 30 years.
(May not be visible in RSS format. Here is the direct link.)
As you can see, in the beginning most of your payment goes towards interest, and only a little reduces your principal, or outstanding loan amount. As time goes on, your payment stays the same, but the chunk going towards interest decreases as the principal shrinks.
Mortgage Principal Prepayment
If you want to pay off the loan in less than 30 years, you’ll have to pay more than required. This is known as principal pre-payment. The effect of making such additional payments can be visualized by imagining that it moves you “ahead” in the amortizaton schedule.
Here’s an example using the schedule shown above. Let’s say you’re just getting ready to make your first payment of $1,074. At this rate, you still have 359 out of 360 monthly payments left to go! How much money would it take to shave off one extra payment off the end? To find that, you just have to look at the principal portion of Month #2, which I highlighted orange: $241.
If you pay $241 additional with your first payment now, you’ll won’t have to pay the $1,074 due on Month #360. Why is this? Working backwards, you can confirm that this is pretty much a 5% compounded return on $241 for 30 years, as expected. In addition, you’ll be shifted forward to Month #3 on the schedule. So next month your (still required) payment of $1,074 will have a bit more applied towards principal, and a bit less towards interest.
Making a 30-year Mortgage into a 15-year Mortgage
This actually creates an interesting way to shorten your mortgage. What if you kept paying the next month’s principal payment on top of your required $1,074 each month. You’d add on $241, then $243, then $245, and so on. Every month you’d shave off one month off the end, leaving you with a 15-year mortgage! You can also imagine this as skipping every other payment by just paying the principal and saving the interest.
This can work out nicely because the extra required will start out reasonably low at $241, and increase gradually with time along with your income and/or cashflow.
An alternative is to add $510 to every payment each month to shorten the term to 15 years. Although if you’re sure you want to do that, you might want to just get a 15-year fixed mortgage at a lower interest rate.
Read on in Part 2: Return on Investment Verification.
April 2009 Financial Status / Net Worth Update
Posted on April 7, 2009 // 33 Comments
Finally a bit of green!
Credit Card Debt
For newer readers, don’t worry. In the past, I have been taking money from credit cards at 0% APR and immediately placing it into high-yield savings accounts or similar safe investments that earn 5% interest or more, and keeping the difference as profit. I even put together a series of step-by-step posts on how to make money off of credit cards this way. However, given the current lack of good no fee 0% APR balance transfer offers, I am just waiting to pay off my existing balances.
Retirement and Brokerage accounts
March was a rebound month for the stock market, and our balances went up accordingly. We contributed $10,000 into IRAs, and $12,969 in 401(k) salary deferral and company match. A chunk of that was a true-up contribution from 2008. Score! See my 2009 Q1 portfolio update for more details.
Cash Savings and Emergency Funds
Our cash savings did drop due to the IRA contributions, but we still have over a years worth of expenses set aside. I want to keep one year of expenses for our emergency fund, and start looking for places to invest the rest.
Home Equity
I used the same internet valuation tools as before – Zillow, Cyberhomes, Coldwell Banker, and Bank of America (old version). The magical elves have decided that my home is worth a tiny bit more this month. The number shown is after another 11% reduction to be more conservative.
It’s been about a year that I’ve had this mortgage, and I am wondering if I should commit some cash towards paying down the mortgage principal too. If I make an extra mortgage payment each year, I replicate a biweekly accelerated payment plan, and can shave around 5 years off my 30-year mortgage.
2009 Q1 Investment Portfolio Update – April 6th, 2009
Posted on April 6, 2009 // 16 Comments
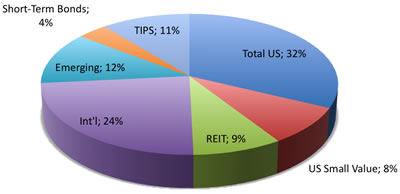
| Retirement Portfolio | Actual | Target |
| Asset Class / Fund | % | % |
| Broad US Stock Market | 32.2% | 34% |
| VTSMX – Vanguard Total Stock Market Index Fund | ||
| DISFX – Diversified Stock Index Institutional Fund* | ||
| FSEMX – Fidelity Spartan Extended Market Index Fund* | ||
| US Small-Cap Value | 8.7% | 8.9% |
| VISVX – Vanguard Small Cap Value Index Fund | ||
| Real Estate (REITs) | 8.7% | 8.5% |
| VGSIX – Vanguard REIT Index Fund | ||
| Broad International Developed | 23.8% | 25.5% |
| FSIIX – Fidelity Spartan International Index Fund* | ||
| International Emerging Markets | 12.1% | 8.5% |
| VEIEX – Vanguard Emerging Markets Stock Index Fund | ||
| Bonds – Short-Term | 3.7% | 3.8% |
| VFISX – Vanguard Short-Term Treasury Fund | ||
| Bonds – Inflation-Indexed | 10.8% | 11.3% |
| VIPSX – Vanguard Inflation-Protected Securities Fund | ||
| Total Portfolio Value | $120,016 | |
| * denotes 401(k) holding given limited investment options. |
2009 is already over one-fourth over, so I think it’s a good time to check on the ole’ battered portfolio.
Contribution Details
In early 2009, we each made a $5,000 contribution towards our non-deductible IRAs for the 2008 tax year, for a total of $10,000. We have also contributed $12,969 so far into our 401ks through regular salary deferrals and the company match. We haven’t made any after-tax investments in our portfolio yet.
YTD Performance
According to my spreadsheet, the 2009 year-to-date time-weighted performance of our personal portfolio is -15.5% YTD.
For reference, the Vanguard S&P 500 Fund has returned -6% YTD, their FTSE All World Ex-US fund has returned –6.36% YTD, and their Total Bond Index fund is -0.13% YTD as of 12/8/08. The Vanguard Target 2045 Fund has returned -4.70% YTD. Part of the poor relative performance is probably due to the timing of my large lump-sum investments.
Investment Changes
We have used our new contributions to bring us closer to our asset allocation target, with a 85% stocks/15% bonds split.
You can view all my previous portfolio snapshots here.
Zecco April Fools’ Day Error Aftermath
Posted on April 6, 2009 // 8 Comments
Apparently my post on the million dollar account balances at Zecco Trading got picked up by The Consumerist over the weekend, but the tone was changed with the inflammatory title “Worst April Fools’ Day Joke Ever: Zecco Pretends To Give Away Millions”. People got excited, the SEC got involved, and the entire post over there has since been revised (see URL for original title) to incorporate the official reply from Zecco:
On April 1, 2009, one of our vendors provided Zecco Trading with an incorrect data feed which caused some customers to see erroneously high buying power. This error was quickly corrected, but about 1% of our customers were impacted. All positions in excess of our customers’ true buying power have since been closed. Except in a very small number of egregious and fraudulent cases, customers will not be responsible for losses (or gains) incurred for trades in excess of their buying power.
Additionally, we want to make it clear that contrary to some reports, this was not in any way intentional and was not an April Fool’s joke. We take the integrity of our customers’ accounts very seriously and we have taken measures to ensure this does not happen again. We sincerely apologize to our customers if this caused any confusion.
To be fair to Zecco, I never said it was an April Fools’ joke, I only said it happened on April Fools’ Day and because of that there was (understandable) speculation as to whether it was a joke or a system glitch. It turns out it was the latter. Either way, it’s always a bad idea to spend money that you know isn’t yours.
Zecco April Fools’ Day: Million Dollar Account Balances
Posted on April 2, 2009 // 43 Comments
 I didn’t hear of any exceptional April Fools’ Day jokes this year, but this one caught my eye. Many customers of Zecco Trading logged into their brokerage account yesterday to be greeted with a slightly higher buying power than before… on the order of 6 to 13 million dollars! Thanks to reader Nick for the tip to check my balance. Here is a user-supplied screenshot:
Well, that’s one way to qualify for the Zecco free trades! People on the forums speculated whether this was a April Fools’ Day joke, or a system glitch. They joked about making a big ACH transfer and quitting their jobs.
However, one brave/foolish person posted that he actually put in an order to buy a million dollars worth of shares with their newly found money, and the order was executed! The bad news? The shares were quickly sold later by Zecco… at a market price loss. On top of that, they were charged the $19.99 commission for a broker-assisted trade. Doh! If it was indeed an April Fools’ joke, it definitely wasn’t implemented very well…
Places To Open A Foreign Bank Account To Store Gold
Posted on April 1, 2009 // 24 Comments
After my post about the Permanent Portfolio which included physical gold, a reader asked me where he could open up a foreign bank account to store gold. Well, in the Appendix of the book Fail-Safe Investing, the author did list specific banks that allow U.S. investors to open account and buy gold within them. Here they are:
Anglo-Irish Bank [Austria]
Phone: 011-431 406-6161
URL: http://www.angloirishbank.ie/
Anker Bank / BDGE Group [Switzerland]
Phone: 011-4121 321-0707
URL: http://www.bcge.ch
Canadian Imperial Bank of Commerce [Switzerland]
Phone: 011-4121 215-6087
URL: http://www.cibc.com/
UeberseeBank / AIG Private Bank
Phone: 011-411 267-5555
URL: http://www.ueberseebank.ch/
Browne makes it sound that opening an account at one of these places is as simple as opening an online account with no physical branch near you. He also states that these are either Swiss or Austrian banks, which are bound by the laws of those countries, not the countries of their parent companies. Now, I can’t attest to the accuracy of this list, as the book was last updated around 2001 and I have no personal experience with any of them. Please perform your own due diligence.
The reasons for buying gold in a foreign bank account are primarily to provide a safe store of assets in case of very unlikely (but still possible) situations like war, government collapse/confiscating of assets, or other crisis. I’m not going to participate myself as I see the risks outweigh the benefits – cost, complexity, chance of fraud or loss, etc. – but if you read some of the stories from Argentina’s economic collapse it can get scary.
As for legality, it would seem to be perfect legit. You are simply storing physical gold there. Gold does not produce dividends or interest, so you’d only be liable for taxes if you sold them at a profit.
Brightscope: How Does Your Company’s 401k Plan Compare?
Posted on March 20, 2009 // 8 Comments
Even though most people I know are too scared to even look at their 401(k) statements right now, have you ever thought about how well your company’s plan stacks up to other similar companies? The problem is that 401(k) plans lack transparency. What if every company had to publish their company match, fees, revenue sharing (*cough* kickbacks), investment choices, and vesting schedules? That would certainly produce competition and peer pressure to make better plans.
This is what the website Brightscope is trying to change. Just type in your company name and see an overall rating based on the components I listed above, also some other interesting details like average account balance. As they point out, a poorly designed plan could be costing you hundreds of thousands of dollars over time – or put another way the equivalent of an extra decade of work!
According to their site, BrightScope is the only 401k analytics firm that is truly independent and does not accept compensation in the form of revenue sharing from mutual fund companies or plan providers. This should make them objective. Found via Capital Ideas.
A related site is 401khelp.com, which covers less companies but does offer more insights and opinions on the plans it does cover. Not sure how often it is updated, though.
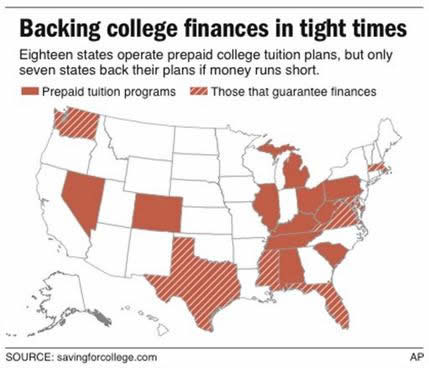
Is Your State Prepaid Tuition 529 Plan Really Safe?
Posted on March 18, 2009 // 21 Comments
I have thought about signing up for a prepaid tuition plan, as I am leaning towards conservative investments for college savings. Lock-in tuition now, and don’t worry about future hikes. However, it appears that even though 18 states have pre-paid tuition plans, only seven of them actually guarantee them – Florida, Maryland, Massachusetts, Mississippi, Texas, Virginia and Washington. (The image below says six, but the article was corrected later to add Virginia.)
Currently, the plan hurting the most publicly is from Alabama, called the Prepaid Affordable College Tuition Plan (PACT). The plan’s asset value dropped from $899 million in September 2007 to $463 million at the end of January, nearly a 50% drop. Why? Because they invested over 70% of their assets in stocks, and also assumed a consistently high rate of return:
According to an actuarial report on the fund filed by the state in January 2008, the fund’s managers then assumed a rate of return of about 8 percent until 2013, and 8.5 percent after that. That report also found that the fund’s liabilities exceeded its assets by about $20 million.
According to fund documents, 42 percent of its assets, as of March 2008, were invested in large market capitalization domestic stocks, 9 percent in small market capitalization domestic stocks, 21 percent in international stocks, 26 percent in domestic fixed-income securities and 2 percent in cash.
48,000 families who were invested in the plan got letters earlier this month that the plan may have trouble meeting its future obligations. To make things worse, their brochures actually once stated that it was guaranteed by the state of Alabama, until later on it was found that wasn’t possible due to state law.
I don’t know about you, but isn’t a guaranteed return the entire point of prepaid tuition plans? I commit money now in order to know that I can afford tuition for my child in the future. I give up the chance for higher returns elsewhere. Otherwise, it’s like heads they win, tails you lose. High returns, they keep the difference. Low returns, they say “oops we got no money”.
Also reported to be in trouble are the programs in Tennessee, South Carolina, West Virginia and Washington. Finally, I also found this article which stated that although guaranteed, the Texas plan had a projected shortfall of $206 million.
 The Best Credit Card Bonus Offers – 2025
 Big List of Free Stocks from Brokerage Apps
 Best Interest Rates on Cash - 2025
 Free Credit Scores x 3 + Free Credit Monitoring
 Best No Fee 0% APR Balance Transfer Offers
 Little-Known Cellular Data Plans That Can Save Big Money
 How To Haggle Your Cable or Direct TV Bill
 Big List of Free Consumer Data Reports (Credit, Rent, Work)