Historical Asset Class Correlations: Which Have Been the Best Portfolio Diversifiers?

When talking about constructing an investment portfolio, you’ll often hear about diversification and buying low-correlation or non-correlated assets.

  • A positive correlation means that the assets tended to move in the same direction. A value of 1 is perfect positive correlation.
  • A negative correlation means that they tended to move in opposite directions. A value of -1 is perfect negative correlation.
  • A zero correlation means that they had no relationship.

Morningstar recently released its 2021 Diversification Landscape Report (free download with e-mail) which includes a lot of great information about the correlations between key asset classes from 2001-2020, including the March 2020 COVID-related market crash. I try not to look too finely at historical numbers, but noticing the overall historical trends can be helpful.

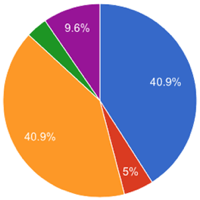
The lower the correlation between asset classes (the less they move in the same direction), the greater the reduction in volatility you get by combining assets. As long as you combine asset classes with correlations below 1, you get some degree of volatility reduction. This M* chart from the paper helps you visualize this:

This handy M* table shows how the 5-year correlations between the total US stock market and other major asset classes have changed over the four separate periods of 2001-2005, 2006-2010, 2011-2015, and 2016-2020:

Some quick takeaways:

  • The best portfolio diversifiers for US stocks has consistently been US Treasury bonds. Short-term, medium-term, long-term Treasuries all have consistently negative correlations to US stocks. (There is some problem with the shading in the chart that doesn’t quite match the numbers.)
  • International developed country stocks, Emerging Markets stocks, and US REITs have high correlations with US stocks (which is somewhat expected), but the correlation is still below 1 (roughly 0.80 or so) such that it still offers a little diversification benefit over time.
  • High-yield “junk” bonds are highly-correlated with US stocks. They are just as highly-correlated as international and emerging market stocks, so watch out if you are chasing higher yield with riskier bonds.
  • Gold has been a pretty good and consistent diversifier as well, but only on par with cash (T-bills) not as good as US Treasuries. You just need to believe that the long-term return of gold is high enough to warrant inclusion. These days, gold actually looks better to me than in the past because I figure it will match inflation, and that’s actually better than most cash and bonds right now. Also see: Gold as a Hedge Against Bonds During Low Interest Rates

Potential Risks of High Interest Stablecoin Savings Accounts

As an extension of High-Yield Crypto Accounts: 6% Interest in Bitcoin or 9% Interest on Stablecoin, I’m trying to better understand the potential scenarios that might cause loss of principal. Even if you’re tired of crypto talk, you should be aware that newer “savings account” apps exist that advertise high interest rates to mainstream customers while playing down their lack of FDIC-insurance and reliance on cryptocurrency markets.

Traditional bank lender model. You deposit your cash into a bank. The bank lends that money out for things like business loans and mortgages, charging them interest. The bank passes on some of the interest to you, and keep the rest as profits for itself. However, if the bank makes enough bad loans, it may not be able to pay the interest or even return all of your deposits. Even so, FDIC insurance will cover deposits up to $250,000 per titled account. This means we don’t have the burden of independently evaluating the quality of every bank. This safety net is critical.

Stablecoin lender model. Traditional banks will not loan out money to people want to put up Bitcoin as collateral. However, there is heavy demand by people with bitcoin/crypto to access cash without actually selling their bitcoin/crypto. Since the big banks are not competing and it’s a risky business, the interest rates charged are high. They have to pay you 8% interest because it’s the only way they can come up with enough cash to fund these loans. If they could get it cheaper elsewhere, don’t you think they would?

For example, BlockFi requires you to put up $200 of BTC for every $100 that you borrow (50% loan-to-value). The idea is that if they don’t pay back the loan on time, BlockFi can just sell the BTC. BlockFi may also sell the BTC anyway if the value drops enough and you don’t post more collateral:

If the value of your collateral significantly decreases, a crypto margin call may occur. Crypto margin calls are calculated based on the LTV (loan-to-value) rate outlined in your loan agreement. A margin call can happen when the value of your collateral drops, increasing the LTV of your loan.

In the event of a margin call, you will have to add more collateral to your account to maintain a healthy LTV ratio. The first margin call occurs at a 70% LTV. At this point, you have 72 hours to take action by posting additional collateral or paying down the loan balance. We will keep you informed if your LTV starts to near the 70% mark so you can take action preemptively.

If your LTV reaches the 80% mark, BlockFi will automatically sell a portion of your crypto collateral to bring your LTV back to a 70% LTV.

Loss scenario: Rapid BTC price drop. BTC prices might drop so steeply (more than 50%) and suddenly (no market liquidity) that BlockFi is unable to liquidate the BTC collateral in time. If they recover less than the original loan amount, and the total losses across their loans are great enough, and they don’t get other backup funding, they may not have the funds to pay back your cash deposits. The price of 1 BTC is $50,000 today, but less than a year ago it was under $10,000, so such a drop is not inconceivable (source):

Loss scenario: Stablecoin price dropping below $1. Stablecoins are supposed to be backed by an equal amount of real money held in a trust account. Right now, the trading price of 1 USDC = $1.00. USDC is issued by Coinbase (now a large publicly-traded company) and is audited monthly by well-known US auditor Grant Thornton LLP that their dollar balances are at least equal to the number of USDC outstanding. However, in the past Tether (USDT), another stablecoin, has had credibility issues regarding its reserves and its price has dropped to as low as $0.88 in the past. Tether was accused of quietly using its cash reserves to help shore up its other struggling businesses. For any stablecoin, if there is even a perceived risk that it is not fully backed by actual US dollars, the price of a stablecoin may drop below the $1.00 peg, which means a loss of principal if you have to sell/withdraw at that price.

Loss scenario: Hacking, accidental loss, and/or internal fraud. There are has been a long history of hacks that have resulted in the theft of many millions of dollars in crypto. Any major loss could bankrupt a company, with obviously some being more vulnerable than others. Coincheck was hacked for $500 million. Per CNBC, the “Canadian crypto exchange QuadrigaCX went bankrupt after its CEO died in 2019, resulting in millions of dollars’ worth of digital assets being trapped in a digital wallet.” This type of thing is why traditional banks don’t want to deal with holding actual cryptocurrency keys. You could view BlockFi’s role as being paid to take on the risk of hacked wallets, lost passwords, and liquidity crunches. As a stablecoin depositor, you are also indirectly making your interest by taking on these risks.

Loss scenario: Drop in interest spreads. This NotBoring longread by Packy McCormick explains in detail why hedge funds are using BlockFi to leverage up their Bitcoin futures arbitrages. This results in a huge demand by these large institutions and a willingness to pay high interest rates. However, as times goes on, these arbitrages will eventually dry up. In the best-case scenario, this will just result in a gradual lowering of interest rates. In a worst-case scenario, a rapid loss of revenue could lead to business failure.

Loss scenario: Sudden government regulation. While part of the allure of cryptocurrencies is the lack of direct government control, the regulation of cryptocurrencies still matters greatly. Just last week, Turkey banned the use of cryptocurrencies for purchasing goods and services. Immediately afterward, Turkish crypto exchange Thodex shut down and $2 billion of investor funds are allegedly missing. Regulation could directly impact these businesses by banning their operations, or indirectly impact them by affecting the price of Bitcoin and other cryptocurrencies.

Due to the lack of FDIC insurance as a backstop, where you keep your stablecoin deposits matters (if you decide to play the game). You’ll want to find a place with a history of strong risk management, security protocols, good financial base, and access to additional capital. For example, BlockFi doesn’t hold private keys, uses Gemini Trust as custodian (one of the most reputable, 95% in cold storage, and regulated by New York state), and most recently raised $350 million at a $3 billion valuation from major venture capital firms. I’m not saying they are 100% safe, but I did look into it pretty deeply considering the small amount of Bitcoin that I hold.

None of these things are a concern if you put your cash in an FDIC-insured bank account. You don’t have to worry about how your bank deals with bad loans, hacking attempts, competitors, or government regulations. This is why I am not moving my cash reserves over to a stablecoin interest account. Cash is for safety, liquidity, sleeping well, and for buying assets on the cheap after any crashes.

Fidelity Spire App $100 Bonus, Fidelity Go Roboadvisor Warning

Updated, including new bonus and tax warning. Fidelity Spire is Fidelity’s new mobile app, which adds fintech-y features and is separate from their main Fidelity app. You can link your external accounts, track balances, and set financial goals. (Fidelity acquired fintech startup eMoney in 2015, and is using that technology for account aggregation.) You can also link up “real” Fidelity accounts like their brokerage accounts and perform commission-free trades within the app.

New $100 Fidelity account bonus. If you open a new, eligible Fidelity account via the Spire app or fidelity.com/spire and maintain an automatic monthly deposit of $25+ for 6 months, you can get a $100 bonus. Hat tip to DoC.

  • You must open via the Fidelitiy Spire app or specific link above, not anywhere else.
  • Eligible accounts include The Fidelity Account®, Fidelity® Cash Management account, Fidelity Roth IRA, or a Fidelity traditional IRA.
  • You must establish a monthly Fidelity Automatic Account Builder (FAAB) plan, an automated deposit feature, on your newly established account for at least $25. First deposit must be within 45 days of opening, and must come from an external, non-Fidelity source. The automatic monthly deposit must remain in effect for at least 6 months (or 6 monthly deposits of at least $25).
  • Bonus limited to $100 per individual in 2021.

Fidelity doesn’t offer bonuses very often, so even though it is not that big, it’s still something if you were planning on opening an account anyway.

While not eligible for the bonus, they are also offering their new Fidelity Go robo-advisor service that automatically invests for you, with no minimum to start and the following fee structure:

  • $10,000 or less: No advisory fee
  • $10,000 to $49,999: Flat $3 a month
  • $50,000 or more: 0.35% annually

The flat fee structure for assets under $50,000 is interesting. At $10,000 in assets, $36 dollars a year = 0.36% annually. At $49,999 in assets, $36 dollars a year = 0.07% annually.

In addition, the underlying mutual funds also offer zero expense ratios. Fidelity actually created a new line of mutual funds called Fidelity Flex Funds for their managed accounts, similar to their other passive and actively-managed mutual funds but with zero expense ratios. For example, there is a Fidelity Flex 500 Fund and a Fidelity Flex International Index fund. However, this special also comes with a drawback.

As with other roboadvisors, the portfolio they choose will be based on you filling out a relatively short online questionnaire. If you aren’t sure about the resulting asset allocation, I recommend going back and change your answers to see the effects. With Fidelity Go, you do not gain access to financial advice from a human advisor. However, you will still gain access to their phone/live chat customer service, which has traditionally been rated highly.

Warning: If you decide to move your money out of Fidelity Go in a taxable account, they will force you to sell all your proprietary Flex fund shares and potentially incur capital gains taxes. If you just owned regular ETFs or mutual funds, you should be able to export the shares “in-kind” without selling and maintain your cost basis. I know you can do this with Betterment and Wealthfront. Depending on how much your account grew, you could consider this a significant “exit fee”.

This is why I still prefer to DIY and construct a portfolio using “high-quality interchangeable parts” that I can keep forever. You can still use Fidelity as I think they are reputable firm with overall good customer service, but instead just buy something like Vanguard Total US Market ETF (VTI) or iShares Core Total US (ITOT).

With free trades now available nearly everywhere, the primary “cost” is the hassle of doing the trades yourself. This is why I recommend also looking at M1 Finance, as they will maintain your target asset allocation for free while still allowing your the ability to port out your investments at any time.

MMB Portfolio Update April 2021: Dividend and Interest Income

dividendmono225

While my April 2021 portfolio asset allocation is designed for total return, I also track the income produced. Stock dividends are the portion of profits that businesses have decided they don’t need to reinvest into their business. The dividends may suffer some short-term drops, but over the long run they have grown faster than inflation. Here is the historical growth of the S&P 500 absolute dividend (source):

This is true despite the fact that the S&P 500 yield percentage are again near historical lows, along with interest rates (source):

I track the “TTM” or “12-Month Yield” from Morningstar, which is the sum of the trailing 12 months of interest and dividend payments divided by the last month’s ending share price (NAV) plus any capital gains distributed over the same period. I prefer this measure because it is based on historical distributions and not a forecast. Below is a rough approximation of my portfolio (2/3rd stocks and 1/3rd bonds).

Asset Class / Fund % of Portfolio Trailing 12-Month Yield (Taken 4/11/21) Yield Contribution
US Total Stock
Vanguard Total Stock Market Fund (VTI, VTSAX)
25% 1.37% 0.36%
US Small Value
Vanguard Small-Cap Value ETF (VBR)
5% 1.59% 0.08%
International Total Stock
Vanguard Total International Stock Market Fund (VXUS, VTIAX)
25% 2.13% 0.53%
Emerging Markets
Vanguard Emerging Markets ETF (VWO)
5% 1.86% 0.09%
US Real Estate
Vanguard REIT Index Fund (VNQ, VGSLX)
6% 3.50% 0.24%
Intermediate-Term High Quality Bonds
Vanguard Intermediate-Term Treasury ETF (VGIT)
17% 1.43% 0.26%
Inflation-Linked Treasury Bonds
Vanguard Short-Term Inflation-Protected Securities ETF (VTIP)
17% 1.37% 0.20%
Totals 100% 1.73%


Trailing 12-month yield history. Here is a chart showing how this 12-month trailing income rate has varied since I started tracking it in 2014.

Portfolio value reality check. One of the things I like about using this number is that when stock prices drop, this percentage metric usually goes up – which makes me feel better in a bear market. When stock prices go up, this percentage metric usually goes down, which keeps me from getting too euphoric during a bull market.

Here’s a related quote from Jack Bogle (source):

The true investor… will do better if he forgets about the stock market and pays attention to his dividend returns and to the operating results of his companies.

This quarter’s trailing income yield of 1.73% is the lowest ever since 2014. This is nearly a full 1% lower than what it was in late 2018. At the same time, my portfolio value is also bigger than ever. If you retired back in say, 2015, your absolute income from dividends and interest is much higher in 2021, even though your yield percentage is lower. You had a good run right after retirement.

However, this is not necessarily good news if you are retiring today. There are countless articles debating this topic, but I historically support a 3% withdrawal rate as a reasonable target for planning purposes if you want to retire young (before age 50) and a 4% withdrawal rate as a reasonable target if retiring at a more traditional age (closer to 65). However, nobody is guaranteeing these numbers and flexibility may be required if there is a bad stock run right after retirement. The “good ole’ days” included the ability to put your money in a CD or high-quality bond and still keep up with inflation…

If you are not close to retirement, there is not much use worrying about it now. Your time is better spent focusing on earning potential via better career moves, investing in your skillset, and/or looking for entrepreneurial opportunities where you own equity in a business asset.

How we handle this income. Our dividends and interest income are not automatically reinvested. I treat this money as part of our “paycheck”. Then, as with a real paycheck, we can choose to either spend it or invest it again. Even if still working, you could use this money to cut back working hours, pursue new interests, start a new business, travel, perform charity or volunteer work, and so on.

MMB Portfolio Update April 2021: Asset Allocation & Performance

portpie_blank200

Here’s an update on my current investment holdings as of April 2021, including our 401k/403b/IRAs, taxable brokerage accounts, and savings bonds but excluding our house, cash reserves, and a small portfolio of self-directed investments. Following the concept of skin in the game, these are my real-world holdings and what I’ll be using to create income to fund our household expenses. We have no pensions or other sources of income.

Actual Asset Allocation and Holdings
I use both Personal Capital and a custom Google Spreadsheet to track my investment holdings. The Personal Capital financial tracking app (free, my review) automatically logs into my different accounts, adds up my various balances, tracks my performance, and calculates my overall asset allocation. Once a quarter, I also update my manual Google Spreadsheet (free, instructions) because it helps me calculate how much I need in each asset class to rebalance back towards my target asset allocation.

Here are updated performance and asset allocation charts, per the “Allocation” and “Holdings” tabs of my Personal Capital account, respectively:

Stock Holdings
Vanguard Total Stock Market (VTI, VTSAX)
Vanguard Total International Stock Market (VXUS, VTIAX)
Vanguard Small Value (VBR)
Vanguard Emerging Markets (VWO)
Vanguard REIT Index (VNQ, VGSLX)

Bond Holdings
Vanguard Limited-Term Tax-Exempt (VMLTX, VMLUX)
Vanguard Intermediate-Term Tax-Exempt (VWITX, VWIUX)
Vanguard Intermediate-Term Treasury (VFITX, VFIUX)
Vanguard Inflation-Protected Securities (VIPSX, VAIPX)
Fidelity Inflation-Protected Bond Index (FIPDX)
iShares Barclays TIPS Bond (TIP)
Individual TIPS bonds
U.S. Savings Bonds (Series I)

Target Asset Allocation. I do not spend a lot of time backtesting various model portfolios, as I don’t think picking through the details of the recent past will necessarily create superior future returns. Usually, whatever is popular in the moment just happens to hold the asset class that has been the hottest recently as well.

Mainly, I try to own broad, low-cost exposure to asset classes that will provide long-term returns above inflation, distribute income via dividends and interest, and finally offer some historical tendencies to balance each other out. I make a small bet that US Small Value and Emerging Markets will have higher future long-term returns (along with some higher volatility) than the more large and broad indexes, although I could be wrong.

While you could argue for various other asset classes, I believe that it is important to imagine an asset class doing poorly for a long time, with bad news constantly surrounding it, and only hold the ones where you still think you can maintain faith through those fearful times. I simply don’t have strong faith in the long-term results of commodities, gold, or bitcoin. (In the interest of full disclosure, I do own tiny bits of gold and BTC amongst my self-directed investments.)

My US/international ratio floats with the total world market cap breakdown, currently at ~57% US and 43% ex-US. I’m fine with a slight home bias (owning more US stocks than the overall world market cap), but I want to avoid having an international bias.

Stocks Breakdown

  • 43% US Total Market
  • 7% US Small-Cap Value
  • 33% International Total Market
  • 7% Emerging Markets
  • 10% US Real Estate (REIT)

Bonds Breakdown

  • 33% High-Quality Nominal bonds, US Treasury or FDIC-insured
  • 33% High-Quality Municipal Bonds
  • 33% US Treasury Inflation-Protected Bonds

I have settled into a long-term target ratio of 67% stocks and 33% bonds (2:1 ratio) within our investment strategy of buy, hold, and occasionally rebalance. I will use the dividends and interest to rebalance whenever possible in order to avoid taxable gains. I plan to only manually rebalance past that if the stock/bond ratio is still off by more than 5% (i.e. less than 62% stocks, greater than 72% stocks). With a self-managed, simple portfolio of low-cost funds, we minimize management fees, commissions, and taxes.

Holdings commentary. Overall, all these numbers keep going up since the March 2020 drop, but I remain anxious about the future. There seems to be lots of money and optimism sloshing around, but there are also so many people still struggling. All I can do is listen to the late Jack Bogle and “stay the course”. I remain optimistic that capitalism, human ingenuity, human resilience, and our system of laws will continue to improve things over time.

In specific terms, I seem to be a little overweight REITs and underweight International Stocks. I may rebalance within tax-deferred accounts if this continues.

I have also been following with interest the new ETFs from both Dimensional Fund Advisors and Avantis (started by former DFA employees). Right now, I don’t need to rebalance out of anything, but in the future I may purchase the DFA Emerging Core Equity Market ETF (DFAE) and Avantis U.S. Small Cap Value ETF (AVUV) instead of my current holdings.

Performance numbers. According to Personal Capital, my portfolio is already up +5.6% since the beginning of 2021. Wow. I rolled my own benchmark for my portfolio using 50% Vanguard LifeStrategy Growth Fund and 50% Vanguard LifeStrategy Moderate Growth Fund – one is 60/40 and the other is 80/20 so it also works out to 70% stocks and 30% bonds. That benchmark would have a total return of +5.2% for 2020 YTD as of 4/9/2021.

The goal of this portfolio is to create sustainable income that keeps up with inflation to cover our household expenses. I’ll share about more about the income aspect in a separate post.

Retirement Savings Rule of Thumb: What Multiple of Income Saved By Age 50?

The WSJ article How to Know if Your Retirement Savings Are on Track tries to answer what is likely a very common question:

My wife and I are in our early 50s. We hope to retire in about a dozen years, and we are trying to figure out if our nest egg is on track. How large should our savings be at our age?

Obviously, everyone’s situation is different, but the WSJ appears to have collected the rules of thumb from a few big financial firms – including Fidelity, T. Rowe Price, and JP Morgan – and averaged them into this chart:

The chart indicates that a couple with a gross household income of $75,000 should target a nest egg of $412,500 at age 55, with that number increasing to $675,000 by age 65. The multiples get bigger with a higher income, I am assuming due to the resulting higher tax rates. It is also unclear if these numbers make any assumptions about Social Security income, but it seems like it does as the numbers appear too low otherwise. I am guessing that they simply assume that the average household spends at least 80% of their income, and bases the Social Security and taxes on that.

Using gross income ignores your actual expenses, but I acknowledge that this is a rough “rule of thumb” and many more people know their gross income than their annual expenses. An alternative rule of thumb is the “4% rule”, which says that you should expect to be able to safely withdraw roughly 4% of your balanced stock/bond portfolio per year (for 30 years) without running out of money. This equates to a rule of saving 25 times the income you want produced. You may already have other income sources. Need $30,000 of annual income above Social Security and a small pension? Then 25 times $30,000 = $750,000 at retirement age.

Perhaps just as importantly, the target moving from 5.5X to 9X income after only 10 years definitely shows (and relies upon) the power of late-stage compounding when a nest egg is already growing. If you manage to get to 5.5X at age 55, your portfolio returns may already be significantly greater than your additional savings in any given year. You have momentum on your side.

This brings me back to my overall reaction to these types of charts. If you are starting with a modest amount, these are huge, scary numbers. They can be so big, you think, why even bother trying? For most people, the key to retirement savings is setting up a system of regular savings and investment, and then letting it run with minimum interruption for 20, 30, 40 years. Focus on setting up the auto-save. Once you get to 1X income, and all the rest will suddenly seem possible.

Best Interest Rates on Cash – April 2021

Here’s my monthly roundup of the best interest rates on cash as of April 2021, roughly sorted from shortest to longest maturities. There are many lesser-known opportunities to improve your yield while keeping your principal “safe” (FDIC-insured or equivalent). Check out my Ultimate Rate-Chaser Calculator to see how much extra interest you’d earn by moving money between accounts. Rates listed are available to everyone nationwide. Rates checked as of 4/5/2021.

Fintech accounts
Available only to individual investors, fintech accounts oftentimes pay higher-than-market rates in order to achieve high short-term growth (often using venture capital). I define “fintech” as a software layer on top of a different bank’s FDIC insurance. Although I do use some of these after doing my own due diligence, read about the Beam app for potential pitfalls and best practices.

  • 3% APY on up to $100,000. The top rate is 3% APY for April through June 2021, and they have not indicated any upcoming rate drop. HM Bradley requires a recurring direct deposit every month and a savings rate of at least 20%. See my HM Bradley review.
  • 3% APY on 10% of direct deposits + 1% APY on $5,000. One Finance lets you earn 3% APY on “auto-save” deposits (up to 10% of your direct deposit, up to $1,000 per month). Separately, they also pay 1% APY on up to another $25,000 with direct deposit. New $50 bonus via referral. See my One Finance review.
  • 3% APY on up to $15,000. Porte requires a one-time direct deposit of $1,000+ to open a savings account. $50 bonus via referral. See my Porte review.
  • 2.15% APY on up to $5k/$30k. Limited-time offer of free membership to their higher balance tier for 6 months with direct deposit. See my OnJuno review.

High-yield savings accounts
While the huge megabanks pay essentially no interest, it’s easy to open a new “piggy-back” savings account and simply move some funds over from your existing checking account. The interest rates on savings accounts can drop at any time, so I list the top rates as well as competitive rates from banks with a history of competitive rates. Some banks will bait you with a temporary top rate and then lower the rates in the hopes that you are too lazy to leave.

  • 1.25% APY on up to $250k. ZYNLO is a division of PeoplesBank with its own FDIC certificate. It also offers 100% roundup matching on debit card purchases if you maintain a $3,000 balance. See my ZYNLO review.
  • T-Mobile Money is still at 1.00% APY with no minimum balance requirements. The main focus is on the 4% APY on your first $3,000 of balances as a qualifying T-mobile customer plus other hoops, but the lesser-known perk is the 1% APY for everyone. Thanks to the readers who helped me understand this. There are several other established high-yield savings accounts at closer to 0.50% APY.

Short-term guaranteed rates (1 year and under)
A common question is what to do with a big pile of cash that you’re waiting to deploy shortly (just sold your house, just sold your business, legal settlement, inheritance). My usual advice is to keep things simple and take your time. If not a savings account, then put it in a flexible short-term CD under the FDIC limits until you have a plan.

  • No Penalty CDs offer a fixed interest rate that can never go down, but you can still take out your money (once) without any fees if you want to use it elsewhere. Marcus has a 7-month No Penalty CD at 0.45% APY with a $500 minimum deposit. AARP members can get an 8-month CD at 0.55% APY. Ally Bank has a 11-month No Penalty CD at 0.50% APY for all balance tiers. CIT Bank has a 11-month No Penalty CD at 0.30% APY with a $1,000 minimum deposit. You may wish to open multiple CDs in smaller increments for more flexibility.
  • Lafayette Federal Credit Union has a 12-month CD at 0.80% APY ($500 min). Early withdrawal penalty is 6 months of interest. Anyone can join this credit union via partner organization ($10 one-time fee).

Money market mutual funds + Ultra-short bond ETFs
Normally, I would say to watch out for brokerage firms that pay out very little interest on their default cash sweep funds (and keep the difference for themselves). However, money market fund rates are very low across the board right now. Ultra-short bond funds are another possible alternative, but they are NOT FDIC-insured and may experience short-term losses in extreme cases. I personally don’t think the risk is worth the tiny yield at this time.

  • The default sweep option is the Vanguard Federal Money Market Fund which has an SEC yield of 0.01%. Vanguard Cash Reserves Federal Money Market Fund (formerly Prime Money Market) currently pays 0.01% SEC yield.
  • Vanguard Ultra-Short-Term Bond Fund currently pays 0.42% SEC yield ($3,000 min) and 0.52% SEC Yield ($50,000 min). The average duration is ~1 year, so your principal may vary a little bit.
  • The PIMCO Enhanced Short Maturity Active Bond ETF (MINT) has a 0.31% SEC yield and the iShares Short Maturity Bond ETF (NEAR) has a 0.45% SEC yield while holding a portfolio of investment-grade bonds with an average duration of ~6 months.

Treasury Bills and Ultra-short Treasury ETFs
Another option is to buy individual Treasury bills which come in a variety of maturities from 4-weeks to 52-weeks. You can also invest in ETFs that hold a rotating basket of short-term Treasury Bills for you, while charging a small management fee for doing so. T-bill interest is exempt from state and local income taxes. Right now, this section isn’t very interesting as T-Bills are yielding close to zero!

  • You can build your own T-Bill ladder at TreasuryDirect.gov or via a brokerage account with a bond desk like Vanguard and Fidelity. Here are the current Treasury Bill rates. As of 4/5/2021, a new 4-week T-Bill had the equivalent of 0.03% annualized interest and a 52-week T-Bill had the equivalent of 0.06% annualized interest.
  • The Goldman Sachs Access Treasury 0-1 Year ETF (GBIL) has a -0.01% SEC yield and the SPDR Bloomberg Barclays 1-3 Month T-Bill ETF (BIL) has a -0.10% (!) SEC yield. GBIL appears to have a slightly longer average maturity than BIL.

US Savings Bonds
Series I Savings Bonds offer rates that are linked to inflation and backed by the US government. You must hold them for at least a year. If you redeem them within 5 years there is a penalty of the last 3 months of interest. The annual purchase limit is $10,000 per Social Security Number, available online at TreasuryDirect.gov. You can also buy an additional $5,000 in paper I bonds using your tax refund with IRS Form 8888.

  • “I Bonds” bought between November 2020 and April 2021 will earn a 1.68% rate for the first six months. The rate of the subsequent 6-month period will be based on inflation again. More info here.
  • In mid-April 2021, the CPI will be announced and you will have a short period where you will have a very close estimate of the rate for the next 12 months. I will have another post up at that time.
  • See below about EE Bonds as a potential long-term bond alternative.

Prepaid Cards with Attached Savings Accounts
A small subset of prepaid debit cards have an “attached” FDIC-insured savings account with exceptionally high interest rates. The negatives are that balances are severely capped, and there are many fees that you must be careful to avoid (lest they eat up your interest). There is a long list of previous offers that have already disappeared with little notice. I don’t personally recommend nor use any of these anymore, as I feel the work required and risk of messing up exceeds any small potential benefit.

  • Mango Money pays 6% APY on up to $2,500, if you manage to jump through several hoops. Requirements include $1,500+ in “signature” purchases and a minimum balance of $25.00 at the end of the month.

Rewards checking accounts
These unique checking accounts pay above-average interest rates, but with unique risks. You have to jump through certain hoops which usually involve 10+ debit card purchases each cycle, a certain number of ACH/direct deposits, and a certain number of logins per month. If you make a mistake (or they judge that you did) you risk earning zero interest for that month. Some folks don’t mind the extra work and attention required, while others would rather not bother. Rates can also drop suddenly, leaving a “bait-and-switch” feeling.

  • The Bank of Denver pays 2.00% APY on up to $25,000 if you make 12 debit card purchases of $5+ each, receive only online statements, and make at least 1 ACH credit or debit transaction per statement cycle. The rate recently dropped. If you meet those qualifications, you can also link a Kasasa savings account that pays 1.00% APY on up to $50k. Thanks to reader Bill for the updated info.
  • Devon Bank has a Kasasa Checking paying 2.50% APY on up to $10,000, plus a Kasasa savings account paying 2.50% APY on up to $10,000 (and 0.85% APY on up to $50,000). You’ll need at least 12 debit transactions of $3+ and other requirements every month. The rate recently dropped.
  • Presidential Bank pays 2.25% APY on balances up to $25,000, if you maintain a $500+ direct deposit and at least 7 electronic withdrawals per month (ATM, POS, ACH and Billpay counts).
  • Evansville Teachers Federal Credit Union pays 3.30% APY on up to $20,000. You’ll need at least 15 debit transactions and other requirements every month.
  • Lake Michigan Credit Union pays 3.00% APY on up to $15,000. You’ll need at least 10 debit transactions and other requirements every month.
  • Find a locally-restricted rewards checking account at DepositAccounts.

Certificates of deposit (greater than 1 year)
CDs offer higher rates, but come with an early withdrawal penalty. By finding a bank CD with a reasonable early withdrawal penalty, you can enjoy higher rates but maintain access in a true emergency. Alternatively, consider building a CD ladder of different maturity lengths (ex. 1/2/3/4/5-years) such that you have access to part of the ladder each year, but your blended interest rate is higher than a savings account. When one CD matures, use that money to buy another 5-year CD to keep the ladder going. Some CDs also offer “add-ons” where you can deposit more funds if rates drop.

  • NASA Federal Credit Union has a special 49-month Share Certificate at 1.50% APY ($10,000 min). Early withdrawal penalty is 1 year of interest. Anyone can join this credit union by joining the National Space Society (free). Note that NASA FCU may perform a hard credit check as part of new member application.
  • Lafayette Federal Credit Union has a 5-year CD at 1.25% APY ($500 min). Early withdrawal penalty is 6 months of interest. Anyone can join this credit union via partner organization ($10 one-time fee).
  • You can buy certificates of deposit via the bond desks of Vanguard and Fidelity. You may need an account to see the rates. These “brokered CDs” offer FDIC insurance and easy laddering, but they don’t come with predictable early withdrawal penalties. Right now, I see a 5-year CD at 0.90% APY vs. 0.98% APY for a 5-year Treasury. Be wary of higher rates from callable CDs listed by Fidelity.

Longer-term Instruments
I’d use these with caution due to increased interest rate risk, but I still track them to see the rest of the current yield curve.

  • Willing to lock up your money for 10 years? You can buy long-term certificates of deposit via the bond desks of Vanguard and Fidelity. These “brokered CDs” offer FDIC insurance, but they don’t come with predictable early withdrawal penalties. You might find something that pays more than your other brokerage cash and Treasury options. Right now, I see a 10-year CD at 1.80% APY vs. 1.70% APY for a 10-year Treasury. Watch out for higher rates from callable CDs from Fidelity.
  • How about two decades? Series EE Savings Bonds are not indexed to inflation, but they have a unique guarantee that the value will double in value in 20 years, which equals a guaranteed return of 3.5% a year. However, if you don’t hold for that long, you’ll be stuck with the normal rate which is quite low (currently 0.10%). I view this as a huge early withdrawal penalty. But if holding for 20 years isn’t an issue, it can also serve as a hedge against prolonged deflation during that time. Purchase limit is $10,000 each calendar year for each Social Security Number. As of 4/5/2021, the 20-year Treasury Bond rate was 2.28%.

All rates were checked as of 4/5/2021.

High-Yield Crypto Accounts: 6% Interest in Bitcoin or 9% Interest on Stablecoin

This WSJ article is the first mainstream financial article that I’ve seen discuss the high interest rates paid on Bitcoin and stablecoin (cryptocurrency backed by a “stable” asset like the US dollar). I am (again) not a cryptocurrency expert, but it does seem appropriate to educate and warn other curious investors about the risks. Here’s my take:

  • The price of Bitcoin can vary a lot. It probably went up or down by a hundred dollars in the time you took to read this sentence.
  • Stablecoin prices tend to vary less because they promise to be backed by a stable asset. USDT (Tether) and USDC (USD Coin) are both currently trading exactly at US$1.00, so it appears that the market believes this claim. However, US dollar stablecoins are not affiliated with the US government or any central bank.
  • Brokers/exchanges where you can buy and sell these cryptocurrencies are not backed by government insurance. They are businesses – some will end up worth billions, some will get bought by a bigger competitor, and some will probably fail (likely because they were hacked). Even though they might be called “savings” or “interest” accounts, no cryptocurrency is held in an FDIC-insured bank, or even an SIPC-insured brokerage account. They will promise to keep your crypto safe and pay interest, but it is possible they may not live up to their end of the deal, AKA “counterparty risk”. Not every exchange is equal.
  • This potential risk is a big reason that they have to pay you 6% annual interest in your Bitcoin and/or 9% annual interest in your USDC stablecoin. They are lending out your assets and earning even more interest, because traditional banks won’t do so.
  • The result is two separate risks – the risk of the price of crypto itself, and counterparty risk of the place holding your crypto.

In the end, I agree with this part of the article (even with the mocking tone):

If you’re a risk-taker who relishes the ride when an asset soars and can laugh off the losses when it crashes, then maybe you should consider letting a broker borrow your cryptocurrency at a generous rate.

After all, if you aren’t troubled by the extraordinary volatility of virtual money, you might as well earn some interest on it.

I did buy some crypto a few years ago as a purely speculative investment and to promote my own learning. We are talking less than 1% of net worth, but it has become a 5-figure amount. I was very skeptical at first, but now I am partial to the theory that either BTC is worth zero, or it will eventually be worth at least on par with the market cap of gold (roughly $200,000). I accept that both scenarios are possible.

I bought Bitcoin using the Voyager app ($25 bonus, publicly-traded with $3 Billion market cap) and also opened an account with BlockFi ($250 bonus, just completed $350m Series D at $3B valuation). Both of these companies are worth well over a billion dollars and gone though various rounds of funding, which isn’t bulletproof but it means that smarter people than me have vetted their security protocols and business practices.

BlockFi pays me 6% interest on up to 2 BTC (8.6% on USDC) and Voyager pays 6.25% interest on BTC (9% on USDC). I reinvest the interest so that I own a little bit more BTC each month. However, I fully accept that I am getting paid this interest and getting the convenience of buying BTC with a few taps in exchange for the potential risk that they will go bust while losing all my BTC. There are other options like hardware wallets, but I am don’t want the inconvenience or to worry about forgetting my bitcoin passwords for my relatively small investment.

Bottom line. Sorry, you can’t earn a 9% “safe” interest rate on your cryptocurrency, even if it is a US-dollar backed stablecoin. At a minimum, you still have counterparty risk. This is a business lending out your assets, charging interest, and giving you a cut. They can go bust, and not all exchanges are the same. Perform your own due diligence when picking a broker/exchange to buy from. I picked what I think are among the safest, but it’s still risky.

Even though the interest rates are quite low, I keep my “safe” cash in FDIC-insured bank accounts and similar.

The Most Popular Ages When People Actually Claim Social Security

Although I’m still decades away from Social Security, I see a constant stream of articles about the “best” time to start taking benefits. Often, you are told to delay claiming until age 70, as you will receive a more valuable, inflation-adjusted, government-guaranteed payout for the rest of your life. But if you have a spouse, it may be better for one of them to claim as early as possible, at age 62. There are many calculators out there – here is one free tool for Optimal Social Security Claiming Strategy.

Apart from the theoretically optimal, when do people actually start taking Social Security? Here is a chart from this Morningstar article (which otherwise includes a lot of speculation):

The three most popular times are:

  • Age 62: As early as possible. Many people feel that they have little choice but to ask for the money the moment it is available. Some have health issues which change the odds against waiting. Some just want the bird in the hand now. Finally, this may be the mathematically optimal strategy for one member of a couple. Together, this makes ASAP the most popular choice by far.
  • Age 66: “Full” retirement. Although there is nothing technically magical about the age 66, it is called “full retirement age” for people retiring in 2019. This is when you’ll get “100%” of your “full” benefits, and anything less is called a “benefit reduction” and anything more is called an “benefit increase”. I wonder if behavior would change if they changed their wording? They could, for example, also just call 62 the base age and call everything after that a benefit increase.
  • Age 70: As late as possible. In order to decline “free” money from the government for 8 years, you must believe in your odds of having an average/above-average life expectancy and have enough financial assets to pay for your expenses during the wait. Less than 10% of people go this route. Your reward is a monthly benefit that is 33% higher than claiming at age 66, and 76% more than claiming at age 62. This increased income will also increase with inflation each year, and inflation-adjusted annuities are only sold by a few insurance companies and are quite expensive.

This matches my anecdotal experience from family and friends. Most people don’t consult a complicated calculator. They either take it as soon as they can for whatever reason, or they “follow the rules” and take it at the “full” retirement age. I’ll probably cough up the money for a calculator when the time comes.

Gold as a Hedge Against Bonds During Low Interest Rates

Perhaps it is because I somehow ended up buying $5,000 in gold coins a couple weeks ago, but I’ve been doing some reading about gold again. The stock market is at higher and higher valuations, while the Fed promises that interest rates will stay low for a long time. The real yield on TIPS remains negative, meaning that it is highly unlikely that any high-quality investment-grade bonds will beat inflation over the next decade. Is there really no alternative?

This Compound Advisors article does a great job exploring why gold is not an ideal hedge against inflation. The comparison chart below of performance since 1975 summarizes things in one picture. Over the 50 years since the US came off the gold standard, gold has only barely kept up with inflation while stocks and REITs… well, just look:

Here is the price of gold over the last decade (FRED).

Okay, so maybe I’m not interested in holding a huge chunk of gold as a long-term asset. But what about a little bit during this strange period of negative real yields? Movement Capital points out in the chart below that gold prices are “tethered” to real interest rates. Gold prices seem to go up when bonds stop keeping up with inflation.

If you own bonds, it is quite possible that your return this year has been negative. I peeked and the Vanguard Total Bond ETF (BND) is down 4% YTD (as of 3/19/21). Gold seems to perform best when bonds perform their worst, as highlighted below:

Therefore, if bonds are supposed to keep your portfolio safe, but right now they are in the vulnerable position of paying out less interest than inflation, gold might be a good complement. Even if gold just matches inflation, you would still come out ahead. Of course, gold often feels so volatile that it is hard to rely on the price for anything specific.

I’ve said before that I simply don’t have the proper faith in gold to own it long-term, and I’m still in that place. I suppose my primary observation is that low interest rates have made nearly everything go up in price (stocks, bonds, real estate, Bitcoin), but gold seems to be mostly ignored.

TIPS Inflation Bonds Performance: Breakeven vs. Actual Inflation Rates

I own inflation-linked bonds as part of my investment portfolio. Specifically, Treasury Inflation-Protected Securities (TIPS) make up about 1/3rd of the bond portion, or 10% of my total portfolio. I go into more detail in my post Reasons To Own TIPS, but essentially they pay interest based on a fixed real yield plus ongoing inflation. To simplify: if the real yield is 1% and inflation is 3%, they pay 4%.

Traditional “nominal” Treasury bonds simply pay a flat interest rate that doesn’t change with inflation (i.e. 3%). The difference between the TIPS real yield and the nominal Treasury yield is at any given time is what inflation would have to be for them to pay out the exact same total yield, called the “breakeven inflation rate”. If the real yield on TIPS is 1% while the nominal rate is 3% at the same moment, then the breakeven rate is 2%. You could call it a market-based prediction of future inflation.

It turns out that 10-year TIPS bonds that matured over the last several years mostly underpeformed regular nominal Treasuries, as the actual inflation turned out to be less than the breakeven inflation rate. David Enna of TIPS Watch created the interesting chart below comparing the final performance of TIPS vs. nominal Treasury bonds maturing over the last several years, where green means that TIPS “won” and red means TIPS “lost” in terms of total return. I removed some columns and highlighted the initial breakeven rate (the market-based guess) and the actual inflation rate.

Enna states:

Still, the market-determined inflation breakeven rate measures sentiment and should not be viewed as an accurate prediction. In fact, the market often does a lousy job of predicting future inflation. The fact is, over the last decade, investors have been betting on higher inflation than actually resulted, and that has led to TIPS (in general) under-performing nominal Treasuries of the same term.

I have read some articles suggesting that you could adjust your TIPS holdings based on the real yield, but perhaps another way is to adjust your holdings based on inflation breakeven rate instead. You can track the 5-year and 10-year breakeven inflation rates at FRED. As of this writing in March 2021, the breakeven inflation rate has been rising very quickly since dropping quickly in early 2020.

The last time that the breakeven inflation rate dropped so drastically was in 2009. As with stocks, it can pay off to buy when everyone else is afraid. I was lucky to buy a chunk of long-term TIPS in 2009, but I didn’t buy much in 2020 since the real yields were still quite low.

I hold Treasuries, TIPS, and FDIC/NCUA-insured CDs because I like my “safe” assets to be of the highest quality, with no worries about getting both my principal and interest. In addition, TIPS also serves as a hedge against higher-than-expected inflation. However, that also means I might suffer if there is lower-than-expected inflation. My “insurance” didn’t pay out over the last 10 years, but that’s okay. I’m also fine if my don’t make a claim on my auto insurance, homeowners insurance, (and definitely life insurance!).

p.s. If you want to buy TIPS, these days you should consider buying Series I Savings Bonds first these days (up to the purchase limits). Their 0% real yield is better than the negative real yields on nearly all TIPS right now.

Best Interest Rates on Cash – March 2021

Here’s my monthly roundup of the best interest rates on “safe” cash as of March 2021, roughly sorted from shortest to longest maturities. I keep 12 months of expenses as part of my semi-retirement cashflow planning, and there are many lesser-known opportunities to improve your yield while still being FDIC-insured or equivalent. Check out my Ultimate Rate-Chaser Calculator to see how much extra interest you’d earn by moving money between accounts. Rates listed are available to everyone nationwide. Rates checked as of 3/8/2021.

Fintech accounts
Available only to individual investors, fintech accounts oftentimes pay higher-than-market rates in order to achieve high short-term growth (i.e. higher interest via venture capital). I define “fintech” as a software layer on top of a different bank’s FDIC insurance. Although I have open accounts with the ones listed below after doing my own due diligence, read about the Beam app for potential pitfalls and best practices.

  • 3% APY on up to $100,000. The top rate is 3% APY for January through March 2021, and they have not indicated any upcoming rate drop. Sign up now and complete a direct deposit to get the highest tier in April. HM Bradley requires a recurring direct deposit every month and a savings rate of at least 20%. See my HM Bradley review.
  • 3% APY on 10% of direct deposits + 1% APY on $5,000. One Finance lets you earn 3% APY on “auto-save” deposits (up to 10% of your direct deposit, up to $1,000 per month). Separately, they also pay 1% APY on up to another $25,000 with direct deposit. New $50 bonus via referral. See my One Finance review.
  • 3% APY on up to $15,000. Porte requires a one-time direct deposit of $1,000+ to open a savings account. $50 bonus via referral. See my Porte review.
  • 2.15% APY on up to $5k/$30k. Limited-time offer of free membership to their higher balance tier for 6 months with direct deposit. See my OnJuno review.

High-yield savings accounts
While the huge megabanks pay essentially no interest, it’s easy to open a new “piggy-back” savings account and simply move some funds over from your existing checking account. The interest rates on savings accounts can drop at any time, so I list the top rates as well as competitive rates from banks with a history of competitive rates. Some banks will bait you with a temporary top rate and then lower the rates in the hopes that you are too lazy to leave.

  • T-Mobile Money has the top rate at the moment at 1.00% APY with no minimum balance requirements. The main focus is on the 4% APY on your first $3,000 of balances as a qualifying T-mobile customer plus other hoops, but the lesser-known perk is the 1% APY for everyone. Thanks to the readers who helped me understand this. There are several other established high-yield savings accounts at closer to 0.50% APY.

Short-term guaranteed rates (1 year and under)
A common question is what to do with a big pile of cash that you’re waiting to deploy shortly (just sold your house, just sold your business, legal settlement, inheritance). My usual advice is to keep things simple and take your time. If not a savings account, then put it in a flexible short-term CD under the FDIC limits until you have a plan.

  • No Penalty CDs offer a fixed interest rate that can never go down, but you can still take out your money (once) without any fees if you want to use it elsewhere. Marcus has a 7-month No Penalty CD at 0.45% APY with a $500 minimum deposit. AARP members can get an 8-month CD at 0.55% APY. Ally Bank has a 11-month No Penalty CD at 0.50% APY for all balance tiers. CIT Bank has a 11-month No Penalty CD at 0.30% APY with a $1,000 minimum deposit. You may wish to open multiple CDs in smaller increments for more flexibility.
  • Lafayette Federal Credit Union has a 12-month CD at 0.80% APY ($500 min). Early withdrawal penalty is 6 months of interest. Anyone can join this credit union via partner organization ($10 one-time fee).

Money market mutual funds + Ultra-short bond ETFs
Normally, I would say to watch out for brokerage firms that pay out very little interest on their default cash sweep funds (and keep the difference for themselves). However, money market fund rates are very low across the board right now. Ultra-short bond funds are another possible alternative, but they are NOT FDIC-insured and may experience short-term losses in extreme cases. I personally don’t think the risk is worth the tiny yield at this time.

  • The default sweep option is the Vanguard Federal Money Market Fund which has an SEC yield of 0.01%. Vanguard Cash Reserves Federal Money Market Fund (formerly Prime Money Market) currently pays 0.01% SEC yield.
  • Vanguard Ultra-Short-Term Bond Fund currently pays 0.38% SEC yield ($3,000 min) and 0.48% SEC Yield ($50,000 min). The average duration is ~1 year, so there is more interest rate risk.
  • The PIMCO Enhanced Short Maturity Active Bond ETF (MINT) has a 0.24% SEC yield and the iShares Short Maturity Bond ETF (NEAR) has a 0.38% SEC yield while holding a portfolio of investment-grade bonds with an average duration of ~6 months.

Treasury Bills and Ultra-short Treasury ETFs
Another option is to buy individual Treasury bills which come in a variety of maturities from 4-weeks to 52-weeks. You can also invest in ETFs that hold a rotating basket of short-term Treasury Bills for you, while charging a small management fee for doing so. T-bill interest is exempt from state and local income taxes. Right now, this section isn’t very interesting as T-Bills are yielding close to zero!

  • You can build your own T-Bill ladder at TreasuryDirect.gov or via a brokerage account with a bond desk like Vanguard and Fidelity. Here are the current Treasury Bill rates. As of 3/5/2020, a new 4-week T-Bill had the equivalent of 0.04% annualized interest and a 52-week T-Bill had the equivalent of 0.08% annualized interest.
  • The Goldman Sachs Access Treasury 0-1 Year ETF (GBIL) has a -0.01% SEC yield and the SPDR Bloomberg Barclays 1-3 Month T-Bill ETF (BIL) has a -0.08% (!) SEC yield. GBIL appears to have a slightly longer average maturity than BIL.

US Savings Bonds
Series I Savings Bonds offer rates that are linked to inflation and backed by the US government. You must hold them for at least a year. If you redeem them within 5 years there is a penalty of the last 3 months of interest. The annual purchase limit is $10,000 per Social Security Number, available online at TreasuryDirect.gov. You can also buy an additional $5,000 in paper I bonds using your tax refund with IRS Form 8888.

  • “I Bonds” bought between November 2020 and April 2021 will earn a 1.68% rate for the first six months. The rate of the subsequent 6-month period will be based on inflation again. More info here.
  • In mid-April 2021, the CPI will be announced and you will have a short period where you will have a very close estimate of the rate for the next 12 months. I will have another post up at that time.
  • See below about EE Bonds as a potential long-term bond alternative.

Prepaid Cards with Attached Savings Accounts
A small subset of prepaid debit cards have an “attached” FDIC-insured savings account with exceptionally high interest rates. The negatives are that balances are severely capped, and there are many fees that you must be careful to avoid (lest they eat up your interest). Some folks don’t mind the extra work and attention required, while others do. There is a long list of previous offers that have already disappeared with little notice. I don’t personally recommend nor use any of these anymore.

  • One of the few notable cards left in this category is Mango Money at 6% APY on up to $2,500, along with several hoops to jump through. Requirements include $1,500+ in “signature” purchases and a minimum balance of $25.00 at the end of the month.

Rewards checking accounts
These unique checking accounts pay above-average interest rates, but with unique risks. You have to jump through certain hoops which usually involve 10+ debit card purchases each cycle, a certain number of ACH/direct deposits, and a certain number of logins per month. If you make a mistake (or they judge that you did) you risk earning zero interest for that month. Some folks don’t mind the extra work and attention required, while others would rather not bother. Rates can also drop suddenly, leaving a “bait-and-switch” feeling.

  • The Bank of Denver pays 2.00% APY on up to $25,000 if you make 12 debit card purchases of $5+ each, receive only online statements, and make at least 1 ACH credit or debit transaction per statement cycle. The rate recently dropped. If you meet those qualifications, you can also link a Kasasa savings account that pays 1.00% APY on up to $50k. Thanks to reader Bill for the updated info.
  • Devon Bank has a Kasasa Checking paying 2.50% APY on up to $10,000, plus a Kasasa savings account paying 2.50% APY on up to $10,000 (and 0.85% APY on up to $50,000). You’ll need at least 12 debit transactions of $3+ and other requirements every month. The rate recently dropped.
  • Presidential Bank pays 2.25% APY on balances up to $25,000, with fewer hoops than some others.
  • Evansville Teachers Federal Credit Union pays 3.30% APY on up to $20,000. You’ll need at least 15 debit transactions and other requirements every month.
  • Lake Michigan Credit Union pays 3.00% APY on up to $15,000. You’ll need at least 10 debit transactions and other requirements every month.
  • Find a locally-restricted rewards checking account at DepositAccounts.

Certificates of deposit (greater than 1 year)
CDs offer higher rates, but come with an early withdrawal penalty. By finding a bank CD with a reasonable early withdrawal penalty, you can enjoy higher rates but maintain access in a true emergency. Alternatively, consider building a CD ladder of different maturity lengths (ex. 1/2/3/4/5-years) such that you have access to part of the ladder each year, but your blended interest rate is higher than a savings account. When one CD matures, use that money to buy another 5-year CD to keep the ladder going. Some CDs also offer “add-ons” where you can deposit more funds if rates drop.

  • Wings Financial Federal Credit Union has a 5-year CD from 1.26% APY ($500 min)up to 1.41% APY ($250,000 min) . Early withdrawal penalty is big – 2 years of interest! Anyone can join this credit union via partner organization for as little as $5 (Wings Financial Foundation).
  • Affinity Plus Federal Credit Union has a 5-year certificate at 1.25% APY ($500 minimum). Early withdrawal penalty is 1 year of interest. 4-year at 1.05% APY, and 3-year at 0.95% APY ($500 minimum). Anyone can join this credit union via partner organization ($25 one-time fee).
  • You can buy certificates of deposit via the bond desks of Vanguard and Fidelity. You may need an account to see the rates. These “brokered CDs” offer FDIC insurance and easy laddering, but they don’t come with predictable early withdrawal penalties. I see a 5-year CD at 0.90% APY right now, which might still pay more than the other options at your brokerage. Be wary of higher rates from callable CDs listed by Fidelity.

Longer-term Instruments
I’d use these with caution due to increased interest rate risk, but I still track them to see the rest of the current yield curve.

  • Willing to lock up your money for 10 years? You can buy long-term certificates of deposit via the bond desks of Vanguard and Fidelity. These “brokered CDs” offer FDIC insurance, but they don’t come with predictable early withdrawal penalties. You might find something that pays more than your other brokerage cash and Treasury options. Right now, I see a 10-year at Vanguard for 1.80% APY. Watch out for higher rates from callable CDs from Fidelity.
  • How about two decades? Series EE Savings Bonds are not indexed to inflation, but they have a unique guarantee that the value will double in value in 20 years, which equals a guaranteed return of 3.5% a year. However, if you don’t hold for that long, you’ll be stuck with the normal rate which is quite low (currently 0.10%). I view this as a huge early withdrawal penalty. But if holding for 20 years isn’t an issue, it can also serve as a hedge against prolonged deflation during that time. Purchase limit is $10,000 each calendar year for each Social Security Number. As of 3/8/2021, the 20-year Treasury Bond rate was 2.18%.

All rates were checked as of 3/8/2021.