Net Worth & Goals Update – July 2010

Net Worth Chart 2010

Time for another net worth update… last one was back in April.

Credit Card Debt
I used to take money from credit cards at 0% APR and place it into online savings accounts, bank CDs, or savings bonds that earned 4-5% interest (much less recently), keeping the difference as profit while taking minimal risk. (Minimal in regards that the risk was under my control.) However, given the current lack of great no fee 0% APR balance transfer offers, I am currently not playing this “game”.

Most credit cards don’t require you to pay the charges built up during a monthly cycle until after a grace period of about 14 days. This theoretically provides enough time for you to receive your statement in the mail and send back a check. As this is simply a real-time snapshot of my finances, my credit card debt consists of just these charges.

Retirement and Brokerage accounts
We recently converted our Traditional IRA balances to Roth IRAs, as the income restrictions were lifted this year. The choice to convert was rather simple for us, as we had non-deductible contributions that will now be able to be withdrawn tax-free. (We still owe taxes on very modest gains.)

Our total retirement portfolio is now $289,277 or on an estimated after-tax basis, $249,976. At a theoretical 4% withdrawal rate, this would provide $833 per month in after-tax retirement income, which brings me to 33% of my long-term goal of generating $2,500 per month.

Cash Savings and Emergency Funds
We are now a bit below a year’s worth of expenses (conservatively estimated at $60,000) in our emergency fund. This is after withholding some money for paying taxes on the Roth IRA conversion above, and also for undisclosed, one-time recent expenses. It’d be fun to say that we picked up a convertible or something, but the reality is much less exciting. 😛

Our cash savings is mostly kept in a combination of a rewards checking account (with debit card usage requirements), a SmartyPig account at 2.15% APY currently, or in a 5-year CD from Ally Bank, which despite the long term still provides a very competitive yield even if you withdraw early before the 5 years is up. (See here for more details.)

Home Value
I am still not using any internet home valuation tools to track home value. After using them for a year and finding them unreliable, I am back to maintaining a conservative estimate and focusing on mortgage payoff. If we get some positive cashflow after retirement savings, I do want to pay it down faster.

Total Stock Returns = Fundamental + Speculative Returns

Another theory of predicting future stock market returns states that there are three main components to long-term stock market performance. Amongst many others, I learned this from authors and investors Jack Bogle and William Bernstein.

Part 1: Dividend Yield
If your stock distributes 2% in dividends each year, then you will have a 2% contribution towards of return. This is what dividend investors love to see coming in each quarter, and is relatively easy to track for a large group of companies. Here it is over time for the S&P 500, courtesy of Multpl.com:

Part 2: Earnings Growth
If earnings stay constant, then all other things equal, one would expect the share price of your company to stay constant as well. If the earnings grow by 5% every year, then your share price will grow by 5% per year. Thus, earnings growth rate is a vital component of total return.

If your portfolio was all of the stocks traded in the United States, like that of a broad-based index fund, this would create a connection between the growth rate of the nation’s Gross Domestic Product and the earnings growth rates of all US companies. In other words, the fundamental return is based on GDP growth. In turn, the GDP growth rate is connected to population growth and productivity per person.

These two parts added to together are coined the fundamental return:

Fundamental Return = Earnings Growth + Dividend Yield

Some bad news: Now, from 1950-2000, fundamental returns were 10%: 4% dividend yield and a 6% earnings growth rate. These days, the S&P 500 has a dividend yield of only about 2%. Earnings growth rate estimates are subject to debate, but they hover around 5-6%.

Part 3: Changes in P/E Ratio
The price-to-earnings (P/E) ratio is the price per share divided by earnings per share. In other words, it is how much investors are willing to pay for each unit of earnings. If they are willing to pay 20 times annual earnings, the share price of the stock will be twice as high as if they only paid 10 times earnings. This part is denoted the speculative return, as it has changed throughout history. Here it is again for the S&P 500:

In 1950, the P/E ratio was less than 10. As of right now in mid-2010, it is 20. It is very unlikely that this more than doubling of price-per-share will happen again, with the historical average being around 15. (During the dot-com bubble, the P/E ratio was over 40. In 2008, it was over 25.) This will lead to a zero, and quite possible negative, future speculative return!

Summary

When predicting future returns, you have to look at all the sources of those expected returns. Fundamental return is still a solid reason why stock prices will go up on the long-term, especially if you are not investing only in one country or economy. Some people call it a belief in capitalism, that economic growth will continue and GDP will continue to increase. I simply believe in the passion and motivation of all the people out there, from Sweden to China to Brazil. However, there is good evidence that you might not be getting 10% historical returns due to P/E ratio contraction.

In a recent column, Larry Swedroe shares that the forecasts that he has read are predicting a 5% total annual growth in earnings and 2% dividends for a total return of 7% (similar to above). Inflation is predicted at 2.5%. However, he points out the current minimal-risk return is pretty low as well, so you need consider the big picture:

The bottom line is that while the expected nominal return to stocks is lower than the historical return, so is the expected return to Treasury bonds. You should decide if the expected risk premium for stocks is sufficient given your unique ability, willingness and need to take risk.

Portfolio Solutions 30-Year Stock/Bond Market Forecast

Every year, the low-fee investment advisor Portfolio Solutions, LLC founded by Rick Ferri provides a 30-year market forecast based on their analysis of several factors. In their own words:

Each year, we analyzed the primary drivers of asset class long-term returns including risk as measured by implied volatility, expected earnings growth based on expected long-term GDP, market implied inflation based on the spread between long-term Treasury Bonds and TIPS, and current cash payouts from interest and dividends on bond and stock indexes. These factors plus others are used in a valuation model to create an estimate for risk premiums over the next 30 years. In a sense, we believe these expected returns reflect what the market is estimating will be a fair payment for each asset class over T-bills over the long-term.

You can view all the asset classes on their site, but I have included some of the major ones below for preservation and reference. Another set of estimates to throw into the mix.

Thirty-Year Return Estimates, Assuming 3% Inflation

Asset Classes

Real Return

With 3% Inflation

Risk*

Government-Backed Fixed Income

Intermediate-term U.S. Treasury notes

1.5

4.5

5.0

Long-term U.S. Treasury bonds

2.0

5.0

5.5

Corporate and Emerging Market Fixed Income

Intermediate-term high-grade corporate (AAA-BBB)

2.3

5.3

5.5

Foreign government bonds (unhedged)

2.5

5.5

7.0

U.S. Common Equity and REITs

U.S. large-cap stocks

5.0

8.0

15.0

U.S. small-cap stocks

6.0

9.0

20.0

REITs (real estate investment trusts)

5.0

8.0

15.0

International Equity (unhedged)

Developed countries

5.0

8.0

17.0

Developed countries small company

6.0

9.0

22.0

All emerging markets including frontier countries

8.0

11.0

27.0

*The estimate of risk is the estimated standard deviation of annual returns.

Future Stock Market Returns: Price-Earnings Ratios as a Long-Term Predictive Tool

As part of gathering the data needed to go beyond net worth, I’ve shown ways to track find your personal savings rate by tracking your current spending with your current after-tax income. For now, I’m skipping ahead to estimating your portfolio’s long-term investment returns.

There are a lot of ways to estimate future stock returns. You’ve probably heard of the P/E ratio, which is usually the price divided by last year’s earnings. This is one measure of “value”. Here is a plot of historical values of the inflation-adjusted S&P 500 index, along with its annual earnings (source).

Historical Price & Earnings Separately
Historical P/E Ratio

As you can see, there is a lot of volatility in P/E ratio. The “P/E 10” ratio is the share price divided by the average earnings over the last 10 years. By taking a long-term average, you smooth out the noise and bumps.

Professor Robert Shiller of Yale University, which provided the above data as well, spoke about the usefulness of this ratio in his book Irrational Exuberance, and provided the data for the following chart. The x-axis shows the real “P/E 10” of the S&P Composite Stock Price Index (inflation adjusted price divided by the prior 10-year mean of inflation-adjusted earnings). The y-axis shows the geometric average real annual return of the same index, reinvesting dividends, and selling 20 years later.

Price-Earnings Ratios as a Predictor of Twenty-Year Returns

You can definitely see the relationship that a higher P/E10 usually leads to a lower future return. However, there is still a great deal of scatter for any given P/E10 ratio.

What about today? As of June 2, 2010 the P/E10 is 19.99 with the S&P 500 index at around 1,098. Historical average is about 15. Back in March 2009 when everything was looking bleak, the P/E10 was 13.32. (P/E10 is also referred to as Cyclically Adjusted Price Earnings (CAPE) ratio.)

The Early Retirement Planning Insights website provides a calculator that forecasts future returns based on the current value of P/E 10, again using historical returns. I’m not sure exactly how they did all the regression. Here’s their return forecast for a P/E 10 ratio of 20.

Future Returns Prediction (P/E10 = 20)

For a 20-year forecast, it shows an average outlook of 4% returns, on a real (after-inflation) basis. Of course, the range indicates that the actual returns could look much worse. As the time-horizon lengthens, the range gets smaller due to the phenomenon of reversion to the mean. Kind of scary to look 60 years ahead!

Warnings

To me, this stuff is useful as a general Big Picture planning tool, not as a short-term trading tool. These are just predictions based on the past, which is often the best we can do, but still far from perfect. Many people use P/E10 as a tool for market timing, shifting their asset allocation as it rises and falls. Shiller himself states that his plot above:

confirms that long-term investors—investors who commit their money to an investment for ten full years—did do well when prices were low relative to earnings at the beginning of the ten years. Long-term investors would be well advised, individually, to lower their exposure to the stock market when it is high, as it has been recently, and get into the market when it is low.

That may be true, but market timing systems can really test an investor’s faith when they seem to be wrong for a long period of time. On a personal basis, I’d probably limit any asset allocation moves – if any – to if the P/E10 ratio moved to an extreme, for example dropped below 10 or above 25.

Calculating Our Personal Savings Rate

Do you know what your household’s savings rate is? Most of us probably have a rough guess, but I wanted to use some more reliable data. Here’s the definition again for my purposes:

Current Spending

There are plenty of ways of tracking your expenditures, as anyone who has tried to follow a monthly budget has found out:

  • Handwritten expense lists
  • Excel or other spreadsheets
  • Online budgeting tools
  • PDA/Smartphone input tools
  • Automated account aggregation tools

I’ve tried various methods to track my expenses manually, but never had the commitment to follow through for more than a month or two at a time. I track all of my numerous financial accounts using account aggregation site Yodlee, but since August 2009 I have linked my primary checking accounts and the few often-used credit cards at the similar-but-nicer Mint.com.

It took a lot of manually categorizing individual transactions, but now it takes less than 10 minutes every couple of weeks at Mint to correct the few new stores I visit (mostly small restaurants). This means I almost have an entire year of spending data from August 2009 to May 2010:

As you can see, there was a general trend, but a few months had major spikes. December had holiday gifts, some travel, and end-of-year charitable giving. In April, we bought a new high-efficiency washer/dryer and had some home electrical-repair bills. In May, we bought our plane tickets and hotel accommodations for a trip to Peru. The lesson here is that there are always going to be these spikes, and it’s best to be prepared and account for them. Our actual average spending ended up being higher than I would have guessed. The monthly fluctuations ranged from 20% below average in October to 30% above average in December.

Current Income

We are a dual-income couple with no kids currently. Our “big-picture budget” is to be able to live off the lesser of our two incomes. We each make relatively good money, so we have been lucky to be able to do this for a few years now. On a practical basis, we do this by having one primary joint checking account in which we only direct deposit that one paycheck. All bills are paid out of this account. This way it psychologically easier to “live within the means” of that single paycheck as the balance goes up and down.

Current Savings Rate

I don’t reveal actual income numbers, so it’s easier to share the savings rate. I am using after-tax income because I feel it is more applicable. According to the above data, on average we spend 84% of the single after-tax paycheck each year, giving us a saving rate of 16%. This is helpful to know we have a buffer if one of us were to lose our jobs. (We also max out the pre-tax 401k plan employee contributions at our jobs, so the single paycheck is already reduce a bit.) When both of our incomes are included, our saving rate is over 60%.

You may consider this low or high, but in terms of early retirement for most people you’ll need to put away a lot more than the 10 to 15% recommended by some experts. I like the idea of both spending a year’s worth of income and saving a year’s worth of income, although this will not be realistic for everyone.

National Personal Savings Rate Definitions: NIPA vs. FoFA

In looking up some stats for personal savings rates, I found that the Bureau of Economic Analysis (BEA) provides a chart of two separate calculations that track the personal savings rates of US taxpayers:

  1. The National Income and Product Accounts (NIPAs) method, and
  2. The Flow of Funds Accounts (FFAs) method

You may find either of these quoted in mainstream media articles whenever there is a big shift or one goes negative temporarily. Both methods have been criticized for the accuracy, in which I won’t go into detail here. The main differences between the NIPA and FoFA methods are outlined in this chart from the AARP paper [pdf] “The Declining Personal Saving Rate: Is There Cause for Alarm?”:

A few things to note:

  • When I read “disposable income”, I normally think of what’s left over after paying for food and shelter. In this case, disposable income is just personal income minus “personal contributions to social insurance and personal taxes”.
  • Both NIPA and FoFA exclude capital gains on investments, which some say contributes to a “wealth effect” where people will spend more because they feel richer due to growth of investments. (not as much recently…)
  • From the chart, FoFA includes the purchase of new assets and investments as personal savings. NIPA includes employee 401(k) and pension contributions as wage income.
  • FoFA treats the purchase of consumer durables (cars, major appliances) as a form of savings, while NIPA treats it as consumption.
  • NIPA says that paying your mortgage (owner-occupied housing) is savings as imputed rent, while FoFA counts your added home equity as an asset, but your mortgage payment as a liability.

Confused yet? Well, I hope at least you came away with something. The AARP paper goes on to explore various theories for the long-term decline of the personal savings rate. If you’re looking for more, here’s another paper that explores the differences.

Beyond Net Worth: Tracking Financial Progress Better

For a while now, I’ve been thinking about a better way to publicly track my progress towards financial freedom and also allow easier comparisons between readers. I’m sure some people would miss the net worth updates, but I have reached the point where our net worth fluctuates mainly with stock market valuations and not due to actual improvements to income or savings rates.

First, I started to brainstorm the required data needed for such tracking, each of which I can address in a future post. Once we collect these numbers, I can then put out some numbers and ratios that could be better indicators than plain net worth. Heck, a portfolio of a million dollars is nothing if you plan on spending $100k a year, but if you only spend $40k a year and have a small pension, you could be all set.

  1. Current Monthly Income (After-Tax)
    How much money are you taking in right now? For those with variable paychecks, it would probably be best to average this out over the trailing 12-months or 6-months.
  2. Current Monthly Spending Rate
    How much are you spending? This should also be averaged out over at least 6 months, in order to capture all those irregular bills like my semi-annual car insurance bill, as well as those unexpected expenses that always pop up. For example, in the last few months alone we have had an $1,000 electrician bill and a $500 auto repair tab.
  3. Current Portfolio Size
    How big is your current investment nest egg? If you include your house, then you’ll need to include the cost of renting in your future spending.
  4. Future Spending Rate
    What is your “burn rate” going to be in retirement or semi-retirement? Many online calculators simply assume this is 85% to 100% of your current monthly spending. This can be too generic. For example, in less than 20 years, I plan to have my house paid off. My mortgage is more than 50% of my current expenses! Other items like health insurance premiums will be harder to predict.
  5. Investment Return
    There are many smart folks making educated guesses about future market returns based on both looking backwards and forward. Based on your chosen asset allocation, one can at least attempt a rough estimate of future after-inflation returns. We can’t rely on these numbers, but it’s a good beginning.
  6. Safe Withdrawal Rate / Retirement Income Rate
    How will you create your income during retirement? If it’s going to be from selling stocks or bonds, you’ll have to decide on how much is okay to withdraw each year so that you don’t run out. Will you draw a fixed percentage each year? Adjust annually for inflation? Adjust annually for market returns?

    What if you are planning to live off dividends or bond income? What if these fluctuate? If you have a pension or annuity, how will this fixed income change how you draw down other assets?

Potential Indicators

A simple example would be calculating your personal savings rate, which would be independent of market fluctuations for most people:

Multiply by 100 for a percentage. Hopefully this isn’t negative! Another good ratio might be your portfolio multiplier factor, which tracks how big your portfolio is relative to your planned future spending.

Depending on who you talk to, a Portfolio Size Factor of 25 to 35 might be desirable if you are withdrawing money from a portfolio of 60% stocks and 40% bonds. Adjustments should be made for pre-tax vs. post-tax accounts.

I could post these and other monthly indicators each month, instead of net worth. What do you think? Any other numbers that I’m missing?

Tracking Inflation: Consumer Price Index Explained – Infographic

The U.S. government tracks inflation in many ways, and one popular way is the Consumer Price Index (CPI). This index is then used to adjust everything from income tax brackets to Roth IRA contributions limits to pension payouts to the return on inflation-linked bonds (TIPS). There are then sub-indices for different groups and regions.

Each month, the Bureau of Labor Statistics gathers 84,000 prices in about 200 categories — like gasoline, bananas, dresses and garbage collection — to form the Consumer Price Index, one measure of inflation. […] The categories are weighted according to an estimate of what the average American spends, as shown below.

The NY Times put together a nice interactive infographic that helps explain the ingredients of the CPI and their relative importance:

You can hover your mouse, and zoom in/out as you like. Does it match your personal spending and inflation rates? Probably not, so it’s good to note the differences. For instance, actual housing prices are not included in the CPI, but instead “owner’s equivalent rent” (24% of CPI) is tracked which is defined as what homeowner’s would pay to rent their home. And once I get my mortgage paid off, I’ll be more worried about other things like health insurance (only 6% of CPI).

Link via the Betterment Blog (Betterment review upcoming).

Are You Protecting Your Most Valuable Asset?

We are all leading busy lives, and it’s all to easy to “miss the woods for the trees”. What if we prioritized by taking a step back and simply asked ourselves – what is our most important asset? Are we adequately protecting that asset?

Yourself

Unless you’ve got a trust fund or are close to retirement, you’re likely going to have to rely on yourself to work for a while. What if you couldn’t? You need disability insurance.

The first place a lot of people go for disability insurance is work. There is either short-term and long-term insurance, and it’s important to know both what triggers a insurance payout and how much money you’ll get. Sometimes, as long as you can sit and do some form of work, you’re not considered disabled. If you want to get a form of disability insurance that kicks when you can’t do your specific job anymore, then I usually see a recommendation to see an independent insurance broker that works with several different insurers. Social Security will kick in as a last resort, but it’s also hard to qualify and definitely won’t replace all your income.

Your Spouse

If you’ve got children or are already disabled yourself, you might depend most on your spouse for income. If that person is your most important asset, then you need both disability and life insurance. Term life insurance is cheaper because it is straight insurance without any investment component to muddle things up. Start with Term4Sale for some quotes and leads to local agents. Don’t forget about life insurance for yourself, as you might be the most important asset to your spouse as well.

Your Home Equity

Even after the credit crisis, a lot of people have a great chunk of their net worth tied up in their house. Do you have adequate homeowner’s insurance? It’s important to check on how much coverage you have, and what it covers. Do you have actual replacement cost coverage, or just an estimate? Are you covered in case of hurricane, flood, or earthquake?

Your Pension / Investments

Perhaps you are nearly or already living off your accumulated assets. Good job! If you have a pension, be aware of the financial stability of your former employer. Understand what the Pension Benefit Guaranty Corporation will pay out in the worst case. Some people decide to take a lump sum in case of future bankruptcy. In general, make sure your investment mix is aligned with your need and tolerance for risk. Consider this rough rule of thumb.

Avoid a Madoff situation. Is someone else in charge of your investments? Do a basic check at FINRA. Whoever manages your portfolio should use an independent financial institution, known as a custodian, to hold your assets. They should also be audited by a licensed, independent, and preferably well-known firm.

As for me, I’ll be looking at some individual disability plans in the near future.

Savings Calculator: Does 1% More Make A Difference?

If you’re like me, your 401k plan comes with a little newsletter each month. A common theme in the world of personal finance advice is to nudge up your savings by one more percentage point a year.

For the “average” person, this is probably not a bad idea. According to the PSCA‘s 52nd Annual Survey of Profit Sharing and 401(k) Plans, the average contribution to a retirement savings plan in 2009 was about $2,114 at a rate of only 5.5% based on a $38,428 annual salary.

Assuming yearly salary raises of 3% and a 6.3% annual rate of return, bumping up that contribution rate by just one percentage point, to 6.5%, could potentially improve savings by close to $6,000 in 10 years and more than $46,000 in 30 years. [source]

But who’s average? The NY Times brings us another pretty interactive calculator where you can input your own numbers and play around. You’ll see what would happen if you increased your savings by one percent, and also what would happen if you increased your savings by 1% every year – up to a max of putting away 16% per year.

I always have to remind myself that $100,000 won’t buy nearly the same amount of stuff in 20 or 30 years. I need to check my math, but you could simply put down how much you expect your raises and investments to outpace inflation, which should provide inflation-adjusted amounts.

Portfolio Check: Do You Need Investment Management Help?

I received a thought-provoking comment last week on my Fidelity Portfolio Advisory Service review. Since this post is a couple months old by now, I doubt most readers saw it. After reading it, my first guess was that somehow the visitor was interested about Fidelity PAS and also read up about my own investing activities.

Even thought the comment wasn’t blatantly baised, on a gut instinct, I checked the IP. As I suspected, the visitor came from a Fidelity Investments internet domain. Still, that doesn’t mean the person is necessarily wrong, just most likely works for Fidelity. 🙂

Anyhow, the comment from “Ryan”:

I would ask yourself why you were “stuck” in cash and missed the market rally. Was it because you were emotionally involved? Trying to time the market and got in/out at the wrong time? Where you frozen to the point where you didn’t know what to do? Those kind of mistakes can REALLY hurt a portfolio’s return in the long run. I would say if you are ready to commit to a discipled strategy and stick to your asset allocation & rebalancing plan, you are ready to manage the portfolio on your own. You can also think about taking 10% of your portfolio to invest in individual stocks to see if you can get lucky with a few and boost your overall return. But you also have to be prepared to do your homework (jim cramer says an hour a week per stock, so thats 10 hr/week) on those stocks. If you are honest with yourself and don’t think you will have the time, expertise, or interest to keep up with the management of your portfolio, best to have someone do it for you whether it be through actively managed funds or professional management.

I both agree and disagree with parts of this comment.

Yes, I agree that it is one thing to set up and asset allocation and re-balancing plan, and it is another to execute it in times of uncertainty and market turmoil. This is your family’s future. Right now, with the S&P 500 at 1200, it would be good to look back over the last couple of years and see if you kept your stock/bond ratio at your desired targets when the markets were doing much worse. We you unsure? Scared to pull the trigger? Wanted the economy to get “just a bit better” before jumping back in?

However, I don’t agree that if you did have problems, the solution is “actively managed funds or professional management”. Well, not exactly. Why not go back to something simple and low-cost, like the Vanguard Target Retirement Funds? You will receive the power of passive investment into thousands of companies representing every industry around the world. You’ll also be invested in high-quality investment grade bonds from the US government, US agencies, and strong corporations. And you don’t have to worry about rebalancing, because they will do it for you. All at a rock bottom price of about 0.20% of assets annually ($20 a year for every $10,000 invested).

Take VTIVX, the fund for folks retiring around 2045. Want an IRA? Set up automatic investments into VTIVX. Got more to spare from the paycheck? Set up a automatic investment in a taxable account? Got a bonus? Throw it into VTIVX or similar. Scared? Just sit tight, VTIVX will rebalance for you. Don’t sell. Don’t buy anything else. Inaction is actually in this case. No, it won’t be perfect, but it will be a lot better that most of the other options out there. If you had trouble recently, perhaps it’s time to go back to simplicity?

In any case, there is no way I’d pay 1.74% in annual fees to Fidelity to manage my portfolio. Such crazy-high fees can also REALLY hurt a portfolios return, like facing a 50 mph headwind. I’d choose a Vanguard Target Retirement fund of comparable allocation over a 15+ year period vs. any Fidelity PAS portfolio any day of the week and twice on Sunday.

NY Times Financial Tune-Up: Interactive Checklist

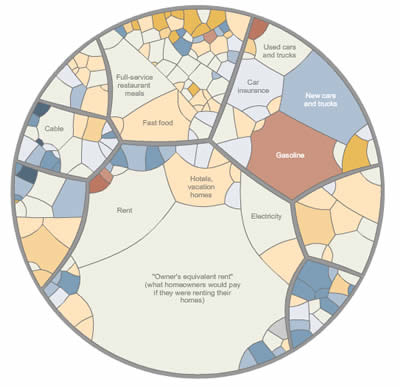
The NY Times has a new series called the Financial Tuneup: Take a Few Hours and Unlock Some Cash. Essentially these are all the things that you probably know you should do, but never get around to. By compiling them all into a interactive checklist, they suggest setting aside a specific time each year to focus on these activities.

Here’s a quick excerpt of the To-Do’s that are included on their 31 item list. If you’ve read virtually any personal finance blog or magazine for longer than 10 minutes, you’re probably familiar with most of them and why they should be done.

  • Rebalance your investment asset allocation
  • Open an online savings account
  • Consolidate to a better rewards credit card
  • Lower your interest rate on existing debt
  • Check your credit reports
  • Check in on your Flexible Spending Account
  • Haggle or shrink your landline, cell phone, and cable bills
  • Update your life insurance to meet needs
  • Shop around for home and/or auto insurance

Reading through the list, it reminded me a lot of the 15-Minute New Year’s Resolutions that I introduced this January (but then lost a little steam). It also fits in well with the new Gladwell-esque book The Checklist Manifesto by Atul Gawande, which explores the power of checklists and how they can reduce mistakes in even simple areas like hand-washing and make complex tasks much more manageable. It easy to see how a checklist in this scenario can help you focus your energy and reduce oversights.

As long as it can reduce the barrier to action enough for people to check off a few more items, I’d say it was a great idea. Are you motivated yet?